Written by Nick Ackerman, co-produced by Stanford Chemist.
Lazard Global Total Return and Income Fund Inc (NYSE:LGI) provides investors exposure to a globally positioned portfolio with an emphasis on equity positions. However, it also incorporates emerging market fixed-income securities as well as forward currency contracts. As equities have sold off more recently, this closed-end fund, or CEF, has been taking a hit, and to exacerbate that, the fund’s discount has widened materially. That could be opening up a long-term opportunity for investors to take a position in this hybrid fund.
The Basics
- 1-Year Z-score: -1.95
- Discount: -16.37%
- Distribution Yield: 8.63%
- Expense Ratio: 1.59%
- Leverage: 11.49%
- Managed Assets: $236.5 million
- Structure: Perpetual.
LGI’s investment objective “seeks a total return consisting of capital appreciation and current income.” To achieve this objective, the fund will invest in “a portfolio of approximately 60-80 U.S. and non-U.S. equity securities, generally with a market cap of $2 billion or greater, at the time of purchase, and may invest in emerging markets.” They continue with “it seeks enhanced income by investing in short duration emerging market forward currency contracts and other emerging market debt instruments.”
Lazard Ltd (LAZ) is a relatively smaller asset manager with around $203 billion in total managed assets. LGI is their only current closed-end fund. However, LGI being larger today was a function of a reorganization of Lazard’s other CEF merging into LGI. Still, the fund only reaches around $227 million in total assets managed, and that’s including a bit of leverage.
In this case, the fund is only modestly leveraged. I view that as a positive in the current environment of higher interest rates. This lower leverage has held pretty steady as the fund’s borrowings have remained rather consistent over the last two years.
However, their borrowings aren’t the only form of leverage that the fund employs. As mentioned above, they also take forward currency contracts, and this appears to be a main focus of how the fund operates and intends to provide leverage through these contracts. That’s why leverage in terms of borrowings comes to around a rate of 11.5%. When including these contracts, they put the total leveraged assets at $312.6 million and a leverage ratio of 28.60% as of their last fact sheet.
With this strategy, they also disclose that they calculate their management fee differently (emphasis in original):
This method of calculating the Investment Manager’s fee is different than the way closed-end investment companies typically calculate management fees. Traditionally, closed-end investment companies calculate management fees based on Net Assets plus Borrowings (excluding Financial Leverage obtained through Currency Commitments). The Investment Manager’s fee is different because the Fund’s leverage strategy is different than the leverage strategy employed by many other closed-end investment companies. Although the Fund may employ Borrowings in making Currency Investments, the Fund’s leverage strategy relies primarily on Currency Commitments, rather than relying exclusively on borrowing money and/or issuing preferred stock, as is the strategy employed by most closed-end investment companies. The Investment Manager’s fee would be lower if its fee were calculated only on Net Assets plus Borrowings, because the Investment Manager would not earn fees on Currency Investments made with Currency Commitments (forward currency contracts). (Lazard SEC Form N-CSRS.)
To put it simply, they make sure they get their cut for employing their entire strategy rather than just calculating their management fee against net assets plus borrowings. On the other hand, their management fee is 0.85%, and that’s also lower than the usual standard 1% fee.
Discount Widening Significantly
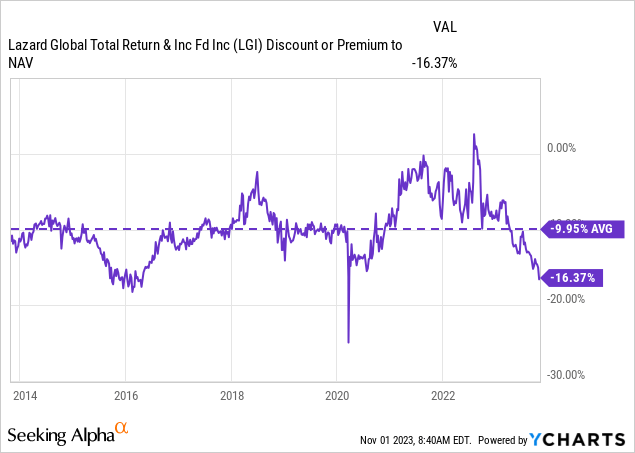
As equities have taken a hit due to rising interest rates, LGI hasn’t been immune. They’ve also seen a decline more recently, and on top of that, the fund’s discount has widened fairly substantially at this point. Given that the fund was trading at a premium for a short period of time in 2022, the drop from that level would have certainly felt more dramatic as well for investors who may have bought around that time.
At this point, the fund is well below its average discount level of the last decade. The longer period of time could be a better representation of where the fund’s discount might be appropriate because the fund running up to a premium was more of an anomaly rather than what had generally been experienced.
The fund has otherwise provided some fairly solid results with its hybrid approach. This is true of the longer-term results, but in the more short-term periods, the fund has struggled. YTD and over the last three months have been particularly bad for the fund. Of course, these weaker results in more recent times would have dragged down the longer-term results since we are looking at annualized performance.
LGI Annualized Performance (Lazard)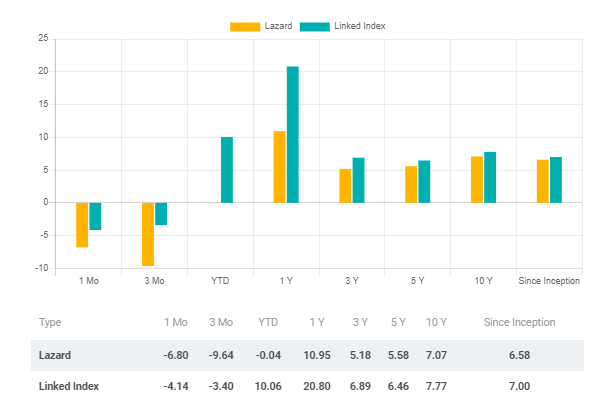
These are the measurements of its total NAV performance as well, and the linked index is the MSCI World Index and MSCI ACWI. The MSCI World Index results were until September 1, 2016, and after that, it has been the MSCI ACWI.
In a more practical comparison with another closed-end fund rather than an unmanaged index that can’t be invested directly in any way, we can look at Eaton Vance comparisons. In particular, the Eaton Vance Tax-Advantaged Global Dividend Income Fund (ETG) and its very similar sister fund, the Eaton Vance Tax-Advantaged Global Dividend Opportunities Fund (ETO), could be appropriate comparisons. The funds are more of your standard hybrid equity and fixed-income funds that employ leverage through borrowings.
Over the last decade, ETG and ETO have been able to exceed LGI’s performance regularly.
YCharts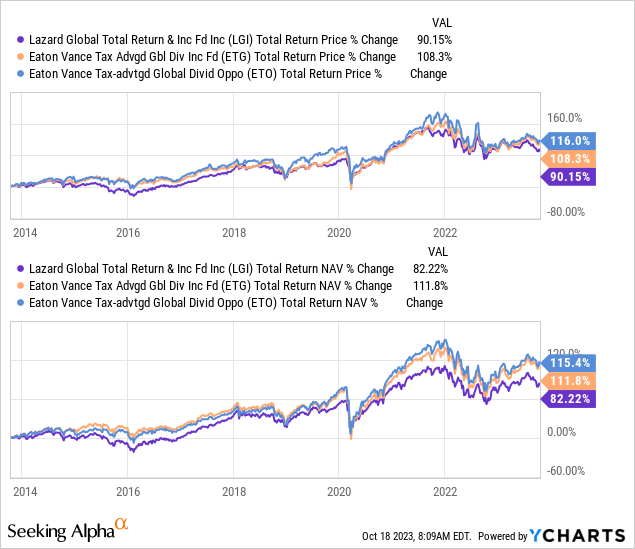
Similarly, on a YTD basis, ETG and ETO have also exceeded the results of LGI.
YCharts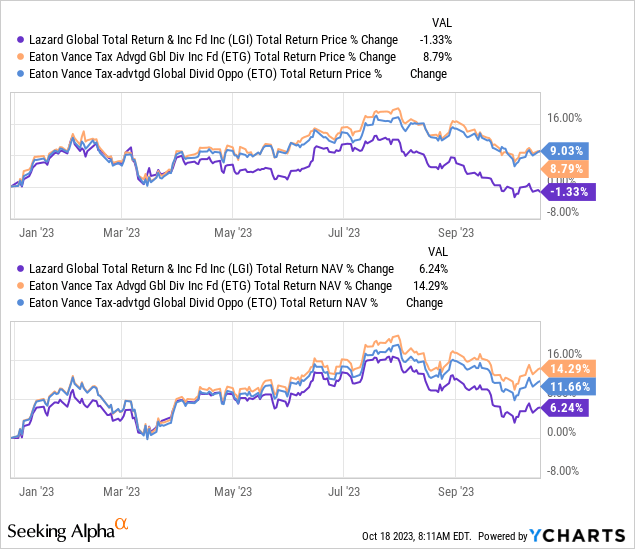
At this time, both ETG and ETO are also sporting some attractive discounts, which could merit some interest from investors seeking alternatives if they believe this outperformance will continue going forward. That being said, LGI’s slightly different approach might appeal to investors who could argue performance may turn in favor of LGI. Additionally, the fund’s discount does put LGI at the more deeply discounted fund on an absolute basis.
7% Managed Distribution
Some investors don’t find funds appealing when they are consistently changing their distribution. However, in the case of LGI, it is on a predictable schedule. This fund, like several other CEFs, employs a managed distribution policy that is reset annually.
LGI Distribution History (CEFConnect)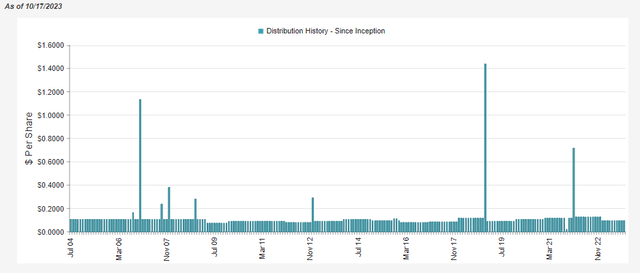
For LGI, the managed distribution policy is based on a 7% NAV rate based on the NAV “as of the close of markets on the last business day of the previous calendar year.”
This makes ‘predicting’ the distribution fairly easy. If NAV is rising through the year and it performs well, the distribution increases. If the fund is not performing well, the next year, the distribution will be cut. This can be a positive as it is a bit of a “self-correcting” policy that can limit NAV erosion over time.
Based on the NAV as of the latest close, the NAV distribution rate comes to 7.22%. That would indicate if the calendar year were to be done today, the distribution would be slightly reduced. 7% might not sound too appealing in the current environment. However, thanks to the fund’s large discount, the distribution yield for the fund comes to 8.63%, which makes it more appealing.
Given this policy, distribution coverage really doesn’t matter, but it’s what one would expect to see. As a fund that is heavy on equity investments and with the utilization of its derivatives strategy, the fund will require significant capital gains as the fund’s net investment income coverage is rather light.
In the first half of the year, between the unrealized and realized gains, they were seeing quite the rebound. They’ve given some of that up at this point, but as the NAV distribution reflects, they have essentially still covered the distribution up until this point.
LGI Semi-Annual Report (Lazard)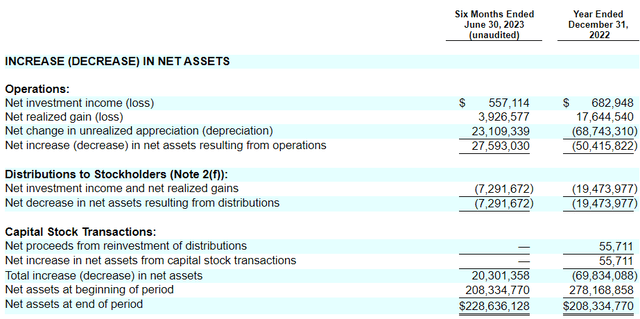
For tax purposes, it is similar to what we would expect with the bulk of the distribution being classified as long-term capital anis or return of capital.
LGI Distribution Tax Classifications (Lazard)
LGI’s Portfolio
The portfolio turnover rate for this fund is quite low. In the last six months, it came in at 5%, which would put it on pace to come in short of last year’s low 15% as well. That means investors in this fund likely aren’t seeing many material changes from year to year.
The fund is primarily invested in global equities as it comes in at nearly 70% of the fund’s weighting. The emerging markets debt and derivatives strategy represents another quarter of the portfolio’s investments, with cash and “other” making up the rest.
LGI Asset Allocation (Lazard)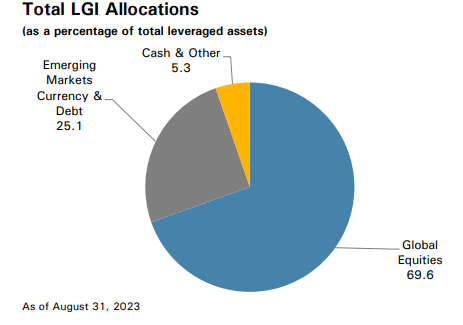
The bulk of the equities portion of the portfolio is listed as North America at nearly 60% of the equity sleeve. It’s a fairly safe assumption to presume that a majority of that North American sleeve is probably dominated by U.S. exposure. Still, that isn’t that unusual when looking even at “global” funds. The U.S. is the largest economy in the world, so it’s fairly easy to understand why it would make up the largest portion of an investment strategy in a global fund. The last time I checked, the U.S. is, in fact, a part of the globe.
LGI Global Exposure (Lazard)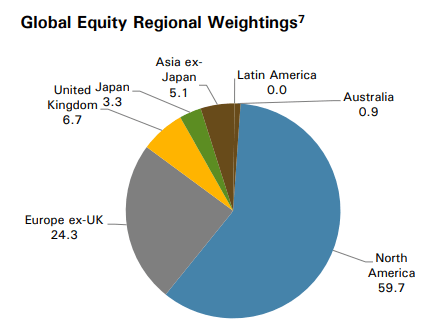
In looking at the portfolio of emerging market currency contracts, we’ll take a look at the listing from their last semi-annual report. At this point, some of these have already matured, meaning we are more or less looking at these to get a bit of a flavor of how the fund can be positioned but not how it is positioned at this time.
LGI Forward Currency Contracts (Lazard)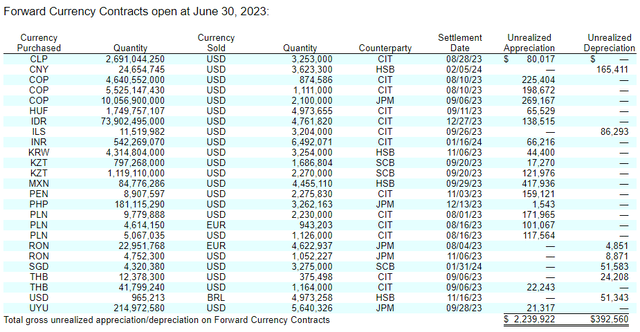
They stated that they focus on short-duration exposure, usually less than one year; maturity has a big role in determining the duration of an investment, so seeing shorter settlement dates here isn’t too surprising.
Another way the fund is fairly unique in its approach is that it invests heavily in tech stocks, but industrials also comprise a fairly material allocation in the fund as well. Industrials are the second largest sector weighting as of their last fact sheet, and behind that are financials.
LGI Sector Allocation (Lazard)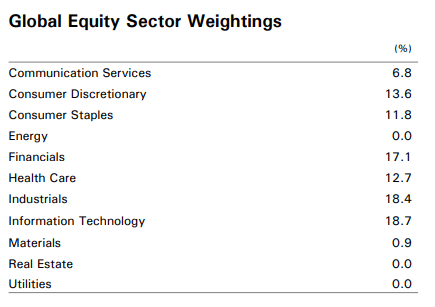
Interesting to note is that they listed no real estate or utilities exposure at the time, and perhaps that’s a good thing as utilities are the worst performing sector on a YTD basis, with real estate coming in toward the bottom as well.
With all this being said, the top positions in the fund are some of the usual suspects. It isn’t the whole Magnificent Seven team, but representatives from there are Microsoft (MSFT), Alphabet/Google (GOOG) and Amazon (AMZN) as the top three holdings that carried a fairly substantial 11.8% weighting of the fund at the time.
LGI Top Ten Holdings (Lazard)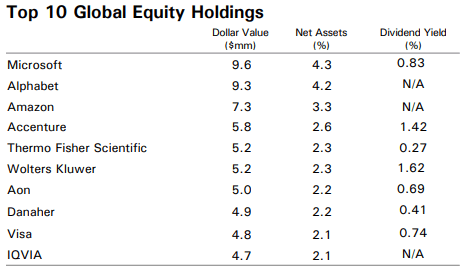
From there, we do have a few other top holdings that aren’t often found as top holdings in other funds, which also represent some of their global exposure. Accenture (ACN) is a tech company that is located in Ireland. Wolters Kluwer (OTCPK:WOLTF) is an industrial sector company that operates in the research and consulting services industry. That company is headquartered in the Netherlands.
Aon plc (AON) is another Ireland-based company that operates in the financial sector in the insurance industry. The company provides “a wide range of risk, reinsurance, retirement and health solutions.”
Conclusion
LGI is fairly unique in its approach, which has led to some pretty solid results for this hybrid fund. That being said, Lazard Global Total Return and Income Fund Inc has also fallen short of more straightforward peers over the long term and short term. At the same time, the fund’s discount has widened materially, and that has opened up a potential opportunity for investors to consider initiating a position at this level. The fund’s 7% managed NAV distribution rate means that while there are annual adjustments to the payout, it is a predictable adjustment.
Read the full article here


