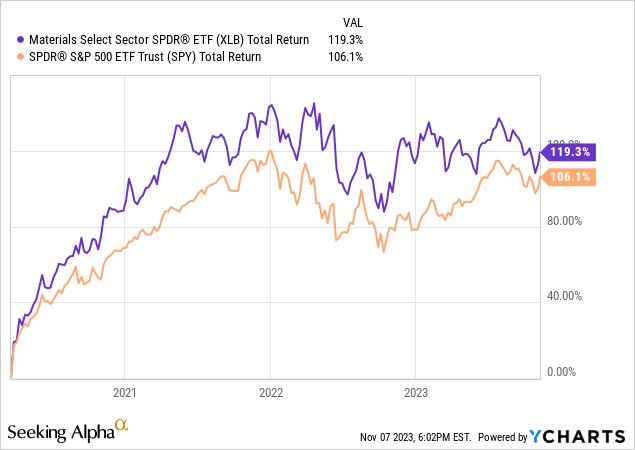
I am not as big a fan of past performance as an investment evaluation tool as many analysts are. But I do find oddities once in a while that help make a point about a particular ETF. The Materials Select Sector SPDR® Fund ETF (NYSEARCA:XLB) is one such example. As you can see below, since the start of the stock market’s rebound from the initial shock of the pandemic (starting on 3/23/2020), XLB’s return exceeded that of SPY by 13%, so a few percentage points per year.

That doesn’t tell us anything about the future. However, the fact that the outperformance of the Basic Materials sector of the S&P 500 did so well during that period, yet we don’t see constant headlines about it, points out a flaw in the way I think many investors approach the stock market today.
Specifically, the bad habit is assuming that the “headline” indexes like the S&P 500 and Nasdaq 100 are the “stock market.” And more than 2 years into what I firmly believe is a bear market cycle, and the start of a longer period of weak returns in those broad market averages, XLB reminds us that profitable investing can come from many corners of the market.
You see, XLB is one of the 11 sector SPDRs that track the 11 S&P 500 sectors. But Basic Materials is the smallest of those sectors, accounting for a mere 2.2% of SPY. And when we look at the S&P 500 as an equal weight index, Basic Materials’ weighting only doubles to about 4.3%.
To paraphrase an old expression, if Basic Materials outperform, will anyone notice? Not if the S&P 500 in aggregate is all you look at. But there is more to this sector for investors to be cognizant of.
XLB: a mix of chemicals, metals and more
XLB’s holdings are primarily companies dealing with the extraction, production, processing, and distribution of chemicals. The chemical industry holdings are 68% of the fund, with companies that mine and work with metals at 15%, containers and shipping at 9% and construction at 6%. Given this concentration of holdings towards chemical industries, XLB is strongly affected by fluctuations in global supply and energy.
The chemical sector has been slowly rebounding from COVID during 2023, as companies destock from the excess they accumulated during the pandemic years and start restocking new products. As the chemical sector recovers and begins to experience growth again, where the companies invest the new capital will decide their competitive edge in the future.
Recently, stakeholder pressure and government policies has been creating incentive to invest in the energy transition out of the fossil fuel energy era and into new, cleaner energy sources. This impacts any petroleum based chemical manufacturers, and many companies are diversifying into producing cleaner energy alternatives such as hydrogen, critical minerals mining and processing, or lithium production.
This hyper-focus on clean and/or renewable energy is creating a convergence of companies into the same sector. While this can create new opportunities for chemical companies, it also brings a high level of competition, especially as “bigger players”, like oil & gas companies, elbow their way into chemical production.
“In 2023, an estimated US$2.8 trillion was invested globally in energy, with more than 60% invested in clean energy technology, such as renewables, EVs, and battery storage.”- IEA.org.
These investments bring a new level of technology, innovation and investment possibilities to the chemical industry. However with the Russia-Ukraine war still going on, the new conflict in the Middle East, and continued economic uncertainty, there is still a high level of volatility as well risks and vulnerabilities, especially in emerging markets globally, where many chemical sector companies have facilities to mine or manufacture chemicals. In order to maintain an economic and competitive edge, the companies within the chemical sector will need to invest finances, time, and human resources towards developing technological solutions and boosting the strength of their supply chains for greater resilience and sustainability.
Key Features
XLB has 32 stock holdings, and has amassed $5.3 billion in assets. So it is not like no one is paying attention.
XLB is very top-heavy with the 10 largest holdings making up 65% of the fund. The top holding, Linde plc (LIN) makes up 21% of the fund on its own, in part a result of its 2018 acquisition of Praxair, which was at the time a large holding in this ETF. Having 1/5 of the ETF in one stock means that LIN has a major influence on XLB. Personally, I like more concentrated ETFs because I know what I own and can track a relatively small number of stocks, using the ETF as a liquid basket of those names.

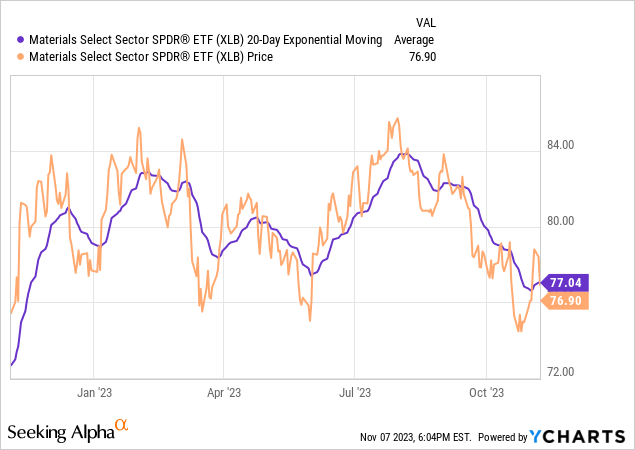
As shown above, XLB’s 20-day moving average recently turned up. We can see that the other 3 times in 2023 that this occurred, the ETF’s price rallied nicely. XLB is showing signs of at least a temporary bottom, but that is outweighed by my broader concerns for nearly the entire stock market.
Below, we see the top 6 holdings, which comprise 50% of XLB’s portfolio. As with other sector and industry ETF’s I’ve written about recently, profitability is not a hurdle to considering this for investment. Growth is solid, and earnings revisions are headed in the right direction. But valuation is clearly an issue.
Seeking Alpha
Summary
XLB has traded in a 10% range from about $76 to $84 all year, and while that might be something a trader will find attractive, I don’t currently consider it to be an upper-tier sector in terms of my decision system. These stocks can be economically sensitive, and I’d rather see the broader economy get through a likely recession next year before getting serious about a long-term stake in XLB.
It gets a Hold rating from me, reflecting my view that it is not bad relatively speaking, but the only way I’m giving out Buy ratings right now for equity ETFs is when I see clearer signs of unimpeded upside. That’s a very thin list currently.
Read the full article here


