Warren Buffett is famous not just for being the most patient, quotable, and best investor in history but also for his love of cash flow and business stability.
Just consider three of his recent big acquisitions as the CEO of Berkshire Hathaway (BRK.A):
- Precision Castparts: $37 billion in 2016 (industrial and aerospace components)
- Burlington Northern: Santa Fe in 2009, $34 billion: railroad
- Bought Dominion’s gas pipeline network for $10 billion in 2020.
Buffett has gotten into tech in recent years through Apple (AAPL) and a bit of Amazon (AMZN), but the greatest investor of all time still loves stable cash flow and businesses he is confident will still be around for 30, 40, or even 50 years or more.
Buffett is also a fan of dividend aristocrats and kings, including Coca-Cola (KO), Chevron (CVX), Johnson & Johnson (JNJ), Procter & Gamble (PG), and Diageo (DEO).
Berkshire owns over $41 billion of these legendary, stable, ultra-dependable dividend world-beaters.
Several Dividend Kings members have asked for an update about Enbridge (NYSE:ENB), a company I think is straight out of Buffett’s playbook. While he doesn’t own it (yet), it’s precisely the kind of Buffett-style aristocrat you can trust with your hard-earned savings.
And today, this 8% yielding aristocrat, with a 100-year growth plan, could be just what you need for you and your children and even your grandchildren to retire in security and splendor.
In fact, I’ll show you three reasons why Enbridge is the perfect 8% yielding Buffett-style aristocrat buy.
Reason One: The Ultimate Mission-Critical Recession-Resistant Business
Enbridge was founded in 1949 making it one of the oldest and most trusted midstreams in the world.
It’s survived and thrived through two oil shocks in the 1970s, -$38 oil in 2020, numerous oil crashes, 20% interest rates, 15% inflation, the Great Financial Crisis, and eight recessions.
earning presentation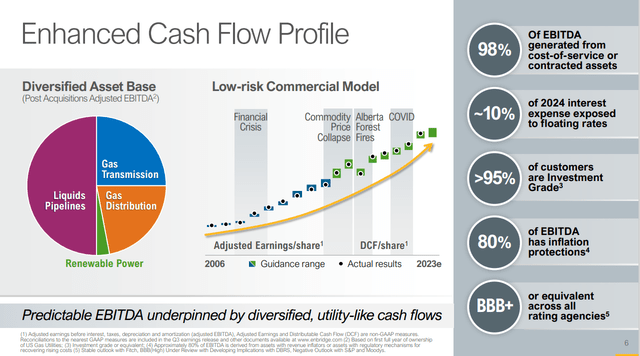
ENB is the king of utility-like cash flow stability growing steadily through the Great Recession, the 2nd worst oil crash in history, the Pandemic (worst oil crash in history), and pretty much anything else that the economy throws at it.
It’s a wonderful inflation hedge, the king of irreplaceable wide-moat hard assets, with the biggest mission-critical asset base in the industry. 98% of its cash flow is contracted (95% with investment-grade customers) and 90% of its debt is a fixed rate, minimizing its exposure to the fastest interest rate hikes in 42 years.
Enbridge’s crown jewel asset is the Mainline system, which transports 70% of Canada’s oil. Its competitor the Trans Mountain Expansion project, has already cost $22 billion and remains mired in costly delays. The best case for the Canadian government, which acquired Trans Mountain from Kinder Morgan after KMI said it would abandon the project, is it comes online at the end of 2024.
ENB just locked in new contracts with its mainline customers through 2028. These are inflation-linked contracts which gives it the most utility-like cash flow of any midstream, just 2% exposure to commodity prices.
ENB’s profits on Mainline, under the new contracts, lock in profitability via option collars, and ensure the dependability of the most dependable dividend in midstream, an impressive 28-year streak.
That dividend is expected to grow 3% annually over time, slightly faster than the bond market’s 2.4% inflation forecast.
Management is guiding for 5% long-term growth which I, and Morningstar think it can achieve (more on this in a moment).
ENB’s goals are to gradually strengthen the dividend over time by reducing the payout ratio even more from already very safe 65% levels.
That will give it even more financial flexibility to make opportunistic acquisitions like it did recently by acquiring not one, not two, but three utility businesses.
Enbridge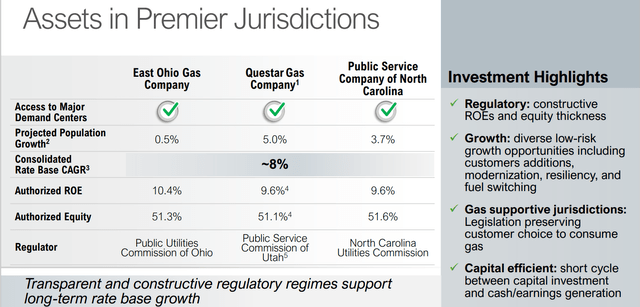
Enbridge is doubling down on its utility businesses as a great diversification from its legacy oil transport business.
Enbridge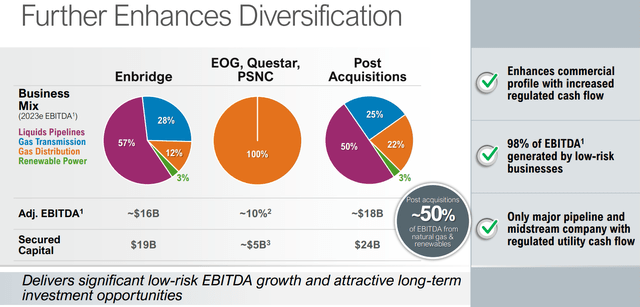
Just like TC Energy (TRP), ENB knows the key to surviving the green energy transition is to diversify rapidly away from oil, which the IEA estimates will peak in terms of global demand by 2029 and then begin a gradual drift lower.
And that brings me to the best part about investing in Enbridge. Not just for the almost 8% very secure yield today, but what that could mean for investors long-term.
Reason Two: 5% Growth, Potentially For The Next 100 Years
Management is guiding for 5% long-term growth and the current median analyst consensus is 3.8%. Why am I so excited about your standard utility growth rate?
Enbridge: Not Just For Retirees…But For Anyone Who Wants To Retire One Day
Say you’re 22 years old and just getting started investing. You don’t have $100,000 to invest, you might only have $1,000 and can only set aside $500 per month.
Let me show you the dividend-fueled magic that is Enbridge.
50-Year Time Horizon: Retire In Safety And Splendor
- assume $1,000 initial investment in your Roth IRA (no taxes or dividend withholding)
- $500 per month contribution to your Roth IRA
- inflation-adjusted (2.4% bond market’s current forecast).
Marketwatch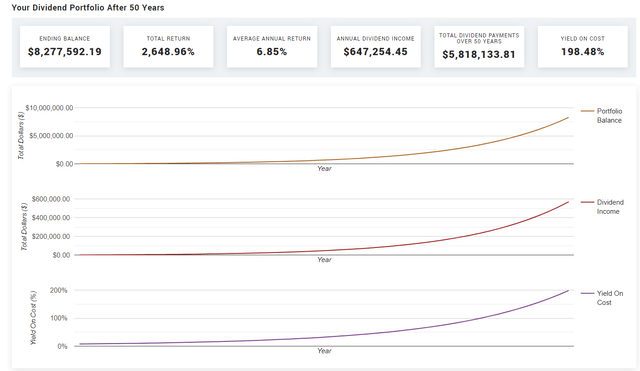
By age 72 in today’s inflation-adjusted dollars, you’re looking at an $8.3 million fortune that’s paying $650,000 worth of dividends…per year! How can I say that dividend blue chips can help almost anyone retire in safety and splendor? This is how!
OK, but how many people have 50 years to let dividends compound?
25-Year Time Horizon: Retire In Comfort And Dignity
Marketwatch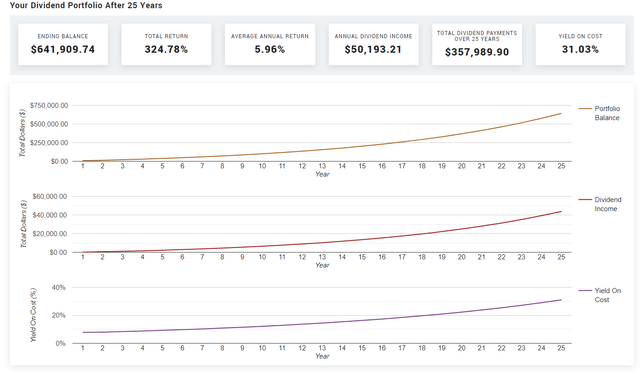
30-Year Time Horizon Already Retired
- assume $100,000 initial investment
- No dividend reinvestment (you spend it all)
- 15% tax rate (most common in the US for retirees)
- inflation-adjusted (2.4% bond market’s current forecast).
Marketwatch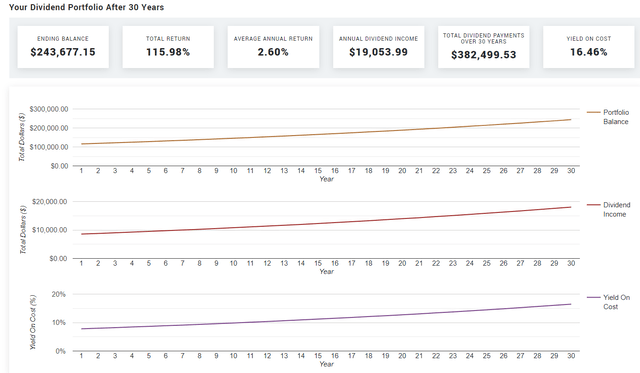
Say you invest $100,000, say 20% of your nest egg into Enbridge today. And that $100,000 not only keeps up with inflation over 30 years but according to management’s guidance will pay $383,000 in inflation-adjusted income over the next 30 years.
And end up worth $244,000.
And be paying almost $20,000 per year in very safe, inflation-adjusted income.
And that’s factoring in taxes!
Now imagine what the rest of your portfolio would do?!
- about $120,000 per year potential income investing in ENB-like companies (adjusted for inflation).
Can you see why I LOVE safe high-yielding world-beater Ultra SWANs like ENB?
Where Is That Growth Going To Come From?
earnings presentation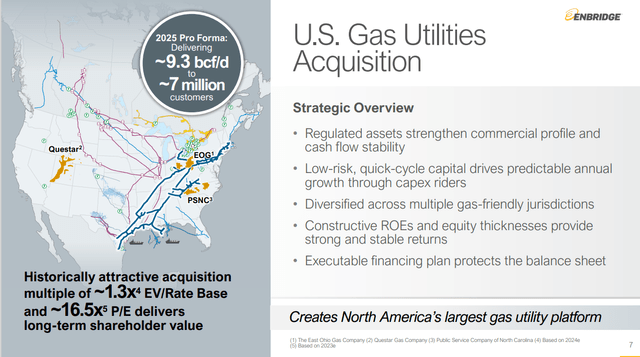
ENB is now the largest gas utility in North America and that mega-deal ($14 billion for 3 companies, 2nd largest midstream acquisition in history) is nearly completely funded.
earnings presentation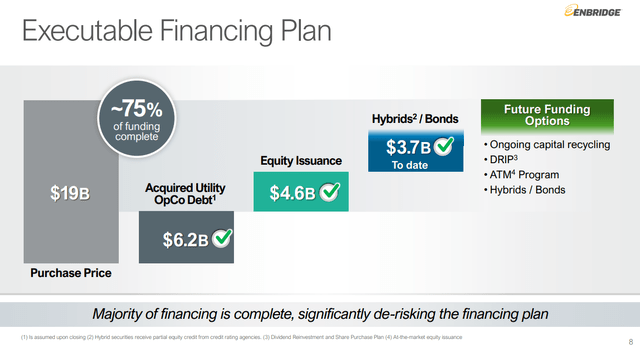
Wait a second, didn’t 100% self-funding midstreams become the gold standard after the disaster of 2014-2016 oil bust? Equity issuances are the devil, right? Actually, real estate investment trusts, or REITs, and utilities have used them for 70+ years safely and effectively.
But what if ENB wanted to be not just self-funding but 100% free cash flow self-funding?
Right now, including the new equity they just issued, there are 2.03 billion ENB shares paying $2.58 per year in dividends.
- $5.2 billion per year dividend cost.
Remember that distributable cash flow is operating cash flow – maintenance capex, the equivalent of REIT AFFO.
Free cash flow (“FCF”) is operating cash flow – all capex, including growth spending.
FCF self-funding is the platinum standard of safety for midstreams. It’s the equivalent of “these dividends get cut when the sun burns out and the world ends.”
Enbridge Medium-Term Growth Consensus
| Year | Dividends ($ Millions) | Free Cash Flow ($ Millions) | Distributable Cash Flow ($ Millions) | FCF Payout Ratio | DCF Payout Ratio (83% Or Less Safe) | Consensus Dividend/share |
| 2022 | $5,245 | $5,616 | 8224.5 | 93% | 64% | $2.58 |
| 2023 | $5,286 | $5,641 | 8128.9 | 94% | 65% | $2.6 |
| 2024 | $5,428 | $5,120 | 8231.4 | 106% | 66% | $2.67 |
| 2025 | $5,570 | $5,411 | 8817.1 | 103% | 63% | $2.74 |
| 2026 | $5,631 | $5,197 | 8949.6 | 108% | 63% | $2.77 |
| 2027 | $6,018 | $5,625 | 9010 | 107% | 67% | $2.96 |
| 2028 | $6,201 | $5,707 | 9364.7 | 109% | 66% | $3.05 |
| Growth Rate | 2.42% | 0.23% | 1.87% | 2.18% | 0.54% | 2.42% |
(Source: FactSet Research Terminal.)
Management’s goal is to maintain a 60% to 70% discounted cash flow (“DCF”) payout ratio compared to 83% safe according to rating agencies.
Here’s how that compares to Enterprise (EPD), TC Energy, and ONEOK (OKE).
- the “fantastic 4” of midstream
- the safest of the safe, the best run, the best management, the best balance sheets.
Enterprise Medium-Term Growth Consensus
| Year | Dividends ($ Millions) | Free Cash Flow ($ Millions) | Distributable Cash Flow ($ Millions) | FCF Payout Ratio | DCF Payout Ratio (83% Or Less Safe) | Dividend/share |
| 2022 | $4,202 | $6,084 | 7751 | 69% | 54% | $1.91 |
| 2023 | $4,400 | $4,161 | 7536.8 | 106% | 58% | $2.00 |
| 2024 | $6,820 | $4,703 | 7769.4 | 145% | 88% | $3.10 |
| 2025 | $7,260 | $5,649 | 7998.2 | 129% | 91% | $3.30 |
| 2026 | $5,016 | $6,958 | 8456 | 72% | 59% | $2.28 |
| 2027 | $5,192 | $7,261 | 8940 | 72% | 58% | $2.36 |
| 2028 | $5,368 | $6,825 | 9325 | 79% | 58% | $2.44 |
| Growth Rate | 3.6% | 1.7% | 2.7% | 1.9% | 0.9% | 3.6% |
(Source: FactSet Research Terminal.)
TC Energy Medium-Term Growth Consensus
| Year | Dividends ($ Millions) | Free Cash Flow ($ Millions) | Distributable Cash Flow ($ Millions) | FCF Payout Ratio | DCF Payout Ratio (83% Or Less Safe) | Dividend/share |
| 2022 | $2,754 | -$380 | 5428 | -725% | 51% | $2.70 |
| 2023 | $2,744 | -$2,885 | 5548 | -95% | 49% | $2.69 |
| 2024 | $2,856 | $458 | 5478 | 624% | 52% | $2.80 |
| 2025 | $2,938 | $1,559 | 6221 | 188% | 47% | $2.88 |
| 2026 | $2,999 | $2,951 | 6581 | 102% | 46% | $2.94 |
| 2027 | $3,182 | $3,053 | 6685 | 104% | 48% | $3.12 |
| 2028 | $3,346 | $2,168 | 6921 | 154% | 48% | $3.28 |
| Growth Rate | 2.8% | -228.2% | 3.5% | -180.2% | -0.7% | 2.8% |
(Source: FactSet Research Terminal.)
ONEOK Medium-Term Growth Consensus
| Year | Dividends ($ Millions) | Free Cash Flow ($ Millions) | Distributable Cash Flow ($ Millions) | FCF Payout Ratio | DCF Payout Ratio (83% Or Less Safe) | Dividend/share |
| 2022 | $1,687 | $1,852 | 2649 | 91% | 64% | $3.74 |
| 2023 | $1,727 | $2,551 | 3940 | 68% | 44% | $3.83 |
| 2024 | $1,768 | $2,832 | 4367 | 62% | 40% | $3.92 |
| 2025 | $1,813 | $3,585 | 4903 | 51% | 37% | $4.02 |
| 2026 | $1,948 | $4,042 | 5128 | 48% | 38% | $4.32 |
| 2027 | $2,025 | $3,811 | 5026 | 53% | 40% | $4.49 |
| 2028 | $2,124 | $4,045 | 5207 | 53% | 41% | $4.71 |
| Growth Rate | 3.3% | 11.8% | 10.1% | -7.6% | -6.2% | 3.3% |
(Source: FactSet Research Terminal.)
You can see that in the medium-term, basically for the rest of this decade, Ultra SWAN midstreams like ENB are planning to keep dividend growth low, just slightly above the rate of inflation.
Truflation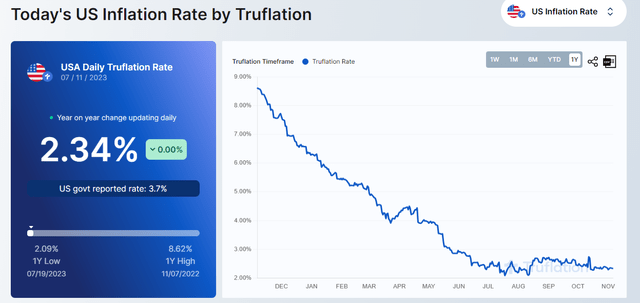
The bond market is pricing in 2.4% long-term inflation (next 30 years) and the real-time inflation report (10 million daily updated data points) is 2.3%.
The industry’s goals are to slowly bring payout ratios down while investing in diversifying assets including renewable energy and utilities.
When considering growth, we think the acquisitions of interests in German offshore wind projects (EnBW’s Hohe See and Albatros) and landfill-to-renewable natural gas assets are intriguing. The offshore wind purchases of EUR 625 million strike us as opportunistic, considering the billions of dollars in write-offs the industry has recently undertaken in the U.S. and Britain primarily due to higher inflation-driven costs and financing costs. The deal is expected to be immediately accretive to earnings.” – Morningstar.
earnings presentation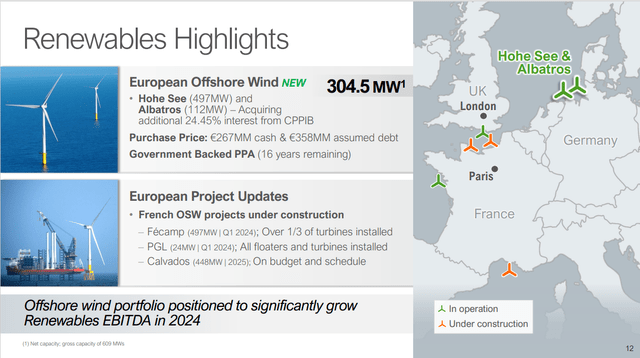
ENB just scored a major wind in purchasing 305 MW worth of offshore wind in Europe that’s backed by 16 years of guaranteed income, from European governments.
Green energy is just 3% of cash flow right now but it’s likely to become the growth driver long-term.
The renewable natural gas portfolio is a larger purchase of derisked RNG assets located in Texas and Arkansas for $1.2 billion that will produce over 4 billion cubic feet of natural gas per year. Demand for RNG is increasing as utilities set RNG blending targets because the upgraded landfill gas is indistinguishable from regular natural gas and can be used with existing infrastructure.
We think the potential here is substantial, especially if Enbridge can link the RNG to its soon-to-be expanded utilities portfolio as there is potential geographic overlap with Questar Gas and East Ohio Gas utility assets. It would be relatively easy to rapidly expand the RNG portfolio over time to supply Enbridge’s utilities footprint, providing a good growth opportunity.” – Morningstar.
And what about in the medium term? ENB can keep buying utilities. Not just gas utilities but potentially electric utilities as well.
companiesmarketcap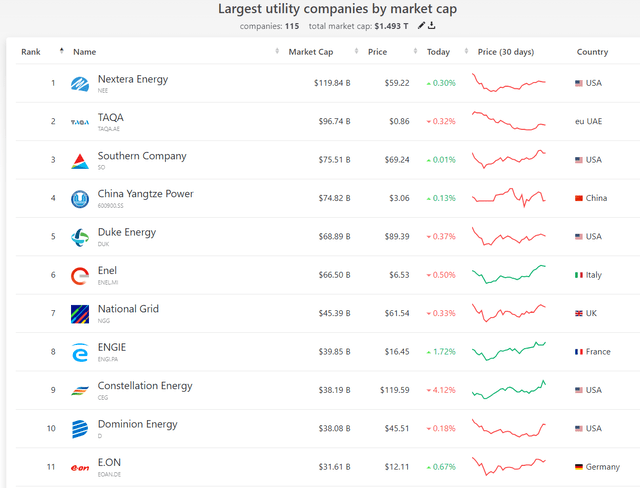
The combined market cap of all publicly traded utilities is $1.5 trillion. The acquiring company has to take on the debt as well and regulators usually permit around 50% or so debt/equity.
- $3 trillion is what it would cost to acquire the 115 largest publicly traded utilities today
- $3.5 trillion including a 30% premium for the stock price.
In other words, in the world of utility M&A, it’s approximately $3.5 trillion target market.
And ENB just pulled off the 2nd largest deal in industry history. What was the biggest? Spectra Energy which Enbridge bought in 2016 for $126 billion enterprise value.
When it comes to midstream ENB is the Berkshire of the industry. Like Buffett, it’s looking to buy entire companies and isn’t afraid to flex its balance sheet muscle to do it.
Who could ENB buy next assuming they are targeting a similarly sized deal as it just pulled off?
companiesmarketcap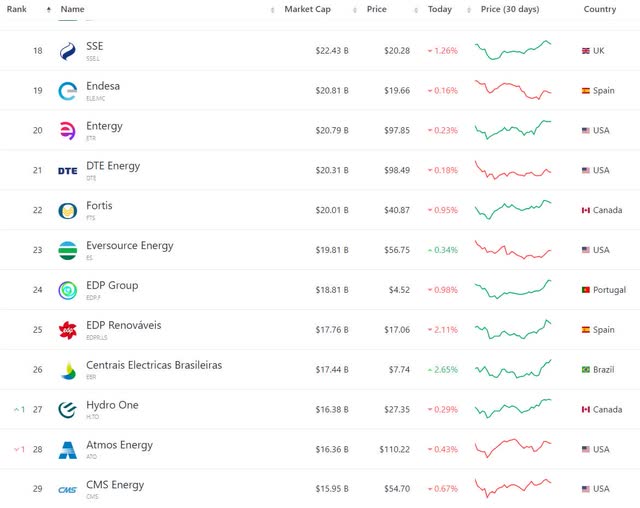
There are plenty of smart opportunities for ENB to buy in the future.
Investor presentation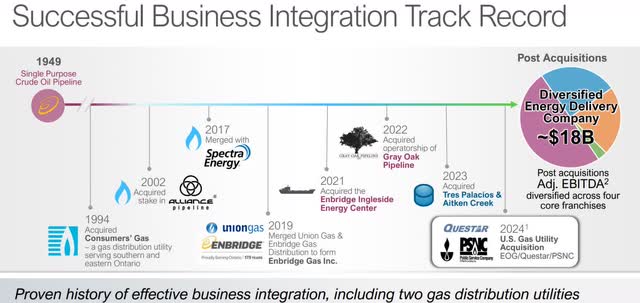
ENB doesn’t buy companies willy-nilly. It’s a disciplined financial investor, much like Buffett, carefully waiting for a strong opportunity to add great assets that it can then find even more growth opportunities.
For example, the 3 companies ENB is buying in 2024? They will add $1.4 billion in growth projects to its backlog.
ENB isn’t out to buy utilities for its own sake. It’s buying steady cash flow and future growth opportunities.
Enbridge averages one acquisition every 3 years, which over the next 100 years could be around 33 more companies.
Fundamentals Summary
- yield: 7.6% (5X S&P 500 and well above SCHD or VYM)
- dividend safety: 100% very safe (1.00% dividend cut risk)
- overall quality: 97% very low-risk Ultra SWAN dividend aristocrat
- credit rating: BBB+ stable (5% 30-year bankruptcy risk)
- long-term growth consensus: 5%
- long-term total return potential: 12.6% vs 10.2% S&P 500 and 12.5% Nasdaq
- current price: $33.85
- fair value: $44.66
- discount to fair value: 24% discount (potential strong buy, bordering on very strong buy) vs 5% overvaluation on S&P
- 10-year valuation boost: 2.8% annually
- 10-year consensus total return potential: 4.6% yield + 8.6% growth + 5.4% valuation boost = 15.4% vs 10.1% S&P
- 10-year consensus total return potential: = 319% vs 158% S&P 500.
How many dividend aristocrats do you know that yield 8% and could more than quadruple in the next decade? And you don’t have to wait ten years to make a healthy profit in Enbridge.
FAST Graphs, FactSet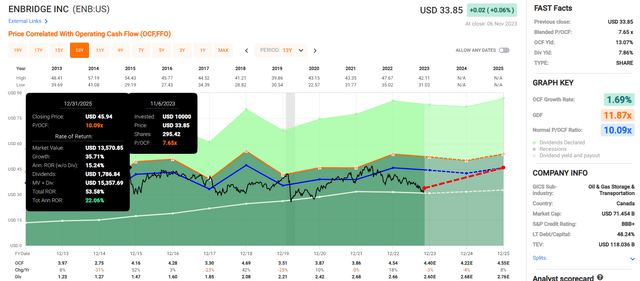
55% upside potential through 2025 and 22% annual return potential. Literally Buffett-like short-term return potential. Now compare that to the pitiful 6% opportunity in the S&P (SPY).
FAST Graphs, FactSet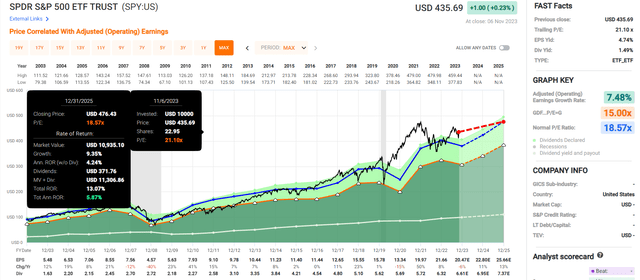
More than 3X the return potential of the S&P 500 and half of that in cold-hard cash.
You can’t get any less speculative than that.
Reason Three: Industry-Leading Risk Management For When Things Inevitably Go Wrong
- ENB is a Canadian company
- 15% dividend tax withholding ON TAXABLE ACCOUNTS
- NONE on tax-free IRA, 401K, Roth IRA, etc.
- Tax credit available for taxable accounts
- requires some paperwork unless you own very few international stocks.
There are no risk-free companies, and no company is right for everyone. You have to be comfortable with the fundamental risk profile.
Risk Profile Summary
Enbridge’s biggest challenges are primarily regulatory, legal, and other stakeholder risks related to identifying and executing on projects within its growth portfolio. Challenges over Line 3, 5, and its small stake in the Dakota Access Pipeline offer clear examples of the potentially higher costs and lost earnings involved.
Material ESG exposures create additional risk for midstream investors. In this industry, the most significant exposures are greenhouse gas emissions (from upstream extraction, midstream operations, and downstream consumption), and other emissions, effluents, pipeline spills, and opposition and protests. In addition to the reputational threat, these issues could force climate-conscious consumers away from fossil fuels in greater numbers, resulting in long-term demand erosion. Climate concerns could also trigger regulatory interventions, such as production limits, removal of existing infrastructure, and perhaps even direct taxes on carbon emissions, which already exists in Canada. Notably, Enbridge recently entered a $1 billion sustainability-linked credit facility and $1 billion bond, which links its ESG performance to borrowing costs.” – Morningstar.
ENB’s Risk Profile Includes
- Economic cyclicality risk: modest cash flow variability in recessions (up to 19% but larger in oil crashes)
- M&A execution risk: from future industry consolidation
- regulatory risk: specifically for new project approvals (Keystone XL is a good example of what can go wrong)
- failure of the green energy transition plan
- talent retention risk in the tightest job market in 54 years
- Cyber-security risk: hackers and ransomware (Colonial pipeline hack is an example of what can happen)
- currency risk, including the dividend.
How do we quantify, monitor, and track such a complex risk profile? By doing what big institutions do.
Long-Term Risk Management Analysis: How Large Institutions Measure Total Risk Management
DK uses S&P Global’s global long-term risk-management ratings for our risk rating.
- S&P has spent over 20 years perfecting its risk model
- which is based on over 30 major risk categories, over 130 subcategories, and 1,000 individual metrics
- 50% of metrics are industry-specific
- This risk rating has been included in every credit rating for decades.
The DK risk rating is based on the global percentile of a company’s risk management compared to 8,000 S&P-rated companies covering 90% of the world’s market cap.
ENB scores 96th Percentile On Global Long-Term Risk Management
S&P’s risk management scores factor in things like:
- supply chain management
- crisis management
- cyber-security
- privacy protection
- efficiency
- R&D efficiency
- innovation management
- labor relations
- talent retention
- worker training/skills improvement
- occupational health & safety
- customer relationship management
- business ethics
- climate strategy adaptation
- sustainable agricultural practices
- corporate governance
- brand management
- interest rate risk management.
ENB’s Long-Term Risk Management Is The 33rd Best In The Master List 93rd Percentile In The Master List)
| Classification | S&P LT Risk-Management Global Percentile |
Risk-Management Interpretation |
Risk-Management Rating |
| BTI, ILMN, SIEGY, SPGI, WM, CI, CSCO, WMB, SAP, CL | 100 | Exceptional (Top 80 companies in the world) | Very Low Risk |
| Enbridge | 96 |
Exceptional |
Very Low Risk |
| Strong ESG Stocks | 86 |
Very Good |
Very Low Risk |
| Foreign Dividend Stocks | 77 |
Good, Bordering On Very Good |
Low Risk |
| Ultra SWANs | 74 | Good | Low Risk |
| Dividend Aristocrats | 67 | Above-Average (Bordering On Good) | Low Risk |
| Low Volatility Stocks | 65 | Above-Average | Low Risk |
| Master List average | 61 | Above-Average | Low Risk |
| Dividend Kings | 60 | Above-Average | Low Risk |
| Hyper-Growth stocks | 59 | Average, Bordering On Above-Average | Medium Risk |
| Dividend Champions | 55 | Average | Medium Risk |
| Monthly Dividend Stocks | 41 | Average | Medium Risk |
(Source: DK Research Terminal.)
ENB’s risk-management consensus is in the top 7% of the world’s best blue chips and is similar to:
- Ecolab (ECL): Super SWAN aristocrat
- UnitedHealth Group (UNH): Ultra SWAN
- Microsoft (MSFT): Ultra SWAN
- Canadian National Railway (CNI): Ultra SWAN aristocrat
- Lockheed Martin (LMT): Ultra SWAN.
The bottom line is that all companies have risks, and ENB is exceptional, at managing theirs, according to S&P.
How We Monitor ENB’s Risk Profile
- 18 analysts
- four credit rating agencies
- 22 experts who collectively know this business better than anyone other than management
- and the bond market for real-time fundamental risk assessment.
When the facts change, I change my mind. What do you do, sir?” – John Maynard Keynes
We have no sacred cows. Wherever the fundamentals lead, we always follow. That’s the essence of disciplined financial science, the math behind retiring rich and staying rich in retirement.
Bottom Line: Enbridge Is The Perfect 8% Yielding Buffett-Style Dividend Aristocrat Buy
There are many wonderful midstreams I can recommend. Enterprise Products is the king of management quality and balance sheet safety but has a K1 that some people just can’t stomach.
TC Energy has the best long-term growth guidance thanks to a very smart long-term focus on gas and utilities.
ONEOK just closed a deal so sweet that management says it might be able to boost its growth to 8% long-term, the highest of any blue-chip midstream.
But Enbridge? This is the ultimate name for those looking for investments based on Buffett’s favorite time period, forever.
There are just two other companies I’m aware of that have ever issued 100-year bonds, Coca-Cola and Disney, and we can all agree they will still exist in a century.
Well, that’s what Enbridge offers. The most utility-like business in its industry, a risk management culture that began investing in the green energy transition two decades ago, and the longest dividend growth streak of any midstream on earth.
Enbridge has been around for 74 years, and the bond market thinks it will reach its 163rd birthday by 2112.
And I’m reasonably confident that Enbridge won’t just become the first dividend king in midstream (in 2045) but also one of the only companies in the world to reach a 100-year streak in 2095.
My point is that Enbridge isn’t just an excellent retirement dream stock for those already retired or hoping to retire soon.
It’s a wonderful choice for anyone hoping to retire in comfort or even safety and splendor at some point.
Are you 20 years old and just starting out? Considering buying some Enbridge every month for the next 50 years and reinvesting the dividends, I can say with 80% statistical confidence that you’ll retire in comfort or even luxury.
If you want to pass on a wonderful energy utility to your children or even your grandchildren, I can think of a few better Buffett-style aristocrats to buy today.
And none that yield a very safe 8%.
Read the full article here


