Since 2021, the Energy Information Administration’s (“EIA’s”) weekly oil storage reports have contended with perpetually elevated adjustment figures. In order to combat this, EIA implemented a 3 part change. Phase 1 was to start tracking transfers to crude oil supply (i.e., blending). This concluded at the end of August, and we have explained this in our U.S. oil production write-ups. Phase 2 was concluded today with EIA implementing “transfers to crude oil supply” in its weekly oil storage report. Phase 3 will include condensate and scrubber oil production in the monthly report. Phase 3 will be done in March 2024, so we will have to wait a bit longer to see just how much is in U.S. crude oil production and how much it’s in condensate.
We applaud EIA for making these challenging changes. It’s not easy to report near real-time data, but when changes happen with data reporting, volatility arises, and data quality will almost certainly deteriorate initially.
But before we begin, let us explain real quick what changed in the weekly oil reports.
EIA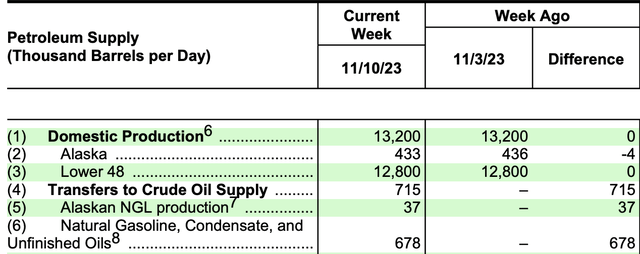
For starters, you can see in the picture above a new section called, “transfers to crude oil supply.” EIA also goes on to break down just how much natural gasoline, condensate, and unfinished oil goes into the blending.
In essence, this was what our modified adjustment of the old captured.
EIA, HFIR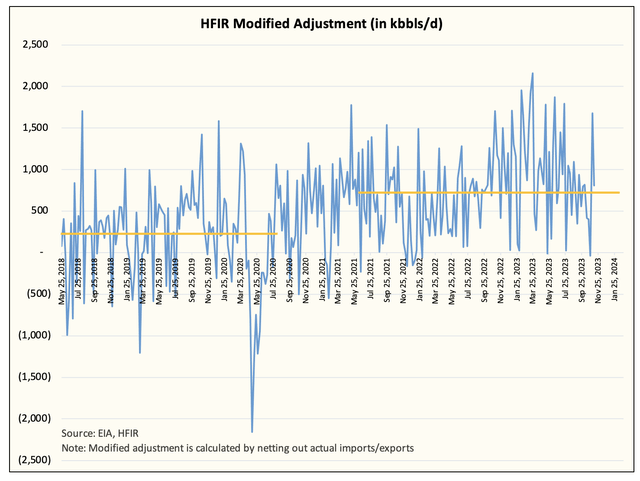
If you look at our modified adjustment since the start of 2021, our dataset averaged ~750k b/d. We used ~750k b/d as our “plant condensate” figure to derive our weekly US crude estimates.
Now, in reality, this is an average, so week-to-week volatility will usually be elevated. But over time, this figure almost always goes back to the mean. In other words, if EIA over-reports crude draws or crude builds, they almost always revert back over the coming weeks.
But one thing you will notice about the modified adjustment table is that in the early part of 2023, there was a prolonged period of elevated modified adjustments. This is because EIA was materially underreporting US oil production in the weekly reports. As a result, our modified adjustment does not take into account what EIA is reporting for US oil production. Instead, our U.S. oil production tracker takes that into account.
HFIR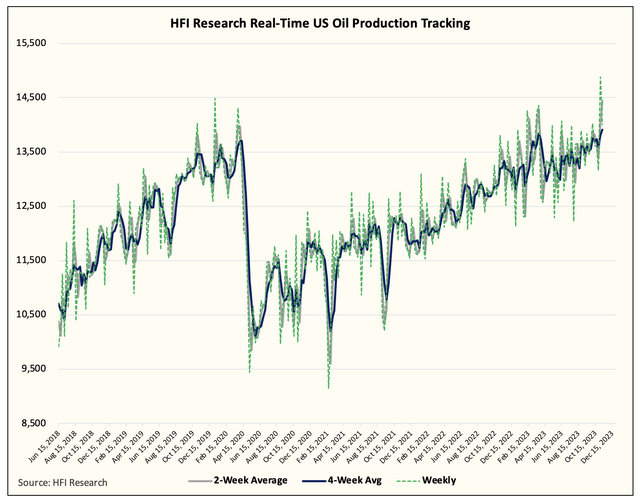
With this change, however, and to keep our dataset consistent, we will still be using transfers to crude oil and the adjustment figure to calculate “real” total crude supplies. Remember, total crude supplies already include the transfer (or, i.e., blending), so excluding that would not present the whole picture.
The formula is simple: U.S. crude oil production + transfers to crude oil + adjustment.
Now there are still major flaws in the weekly oil storage reports that require the modified adjustment. For example, EIA does not take into account real-time U.S. crude exports or imports. So the variance between these two figures could explain large differences in the adjustment. If you took this week for example, the reported adjustment came in at +512k b/d, while our modified adjustment showed +95k b/d. This is because EIA overstated both crude exports and crude imports to the tune of 417k b/d.
So going forward, there will be times when the adjustment comes in massively positive or massively negative, but over time, the adjustment should start to revert back to zero or possibly negative, while transfers to crude oil remain positively around ~+700k b/d.
Funky Data
With all that said, the last two weeks of EIA data were about as funky as funky gets. First, our modified adjustment showed a significant jump for the Nov 3 week. The reported EIA adjustment for Nov 3 came in at +2.147 million b/d. The figure was so out of line that it implicitly assumed US oil production came in at 14.8 million b/d.
Looking at our dataset, this is usually a data quality error, and with time, this almost always reverses. Similarly for this week, implied U.S. oil production came in at ~14 million b/d. While we do think U.S. oil production saw a bump higher over the last two weeks, this is vastly overstating where production is (we are referring to the implied U.S. oil production).
In addition, it wasn’t just the crude side that got impacted. It appears that implied production demand also saw an unjustified jump higher.
EIA, HFIR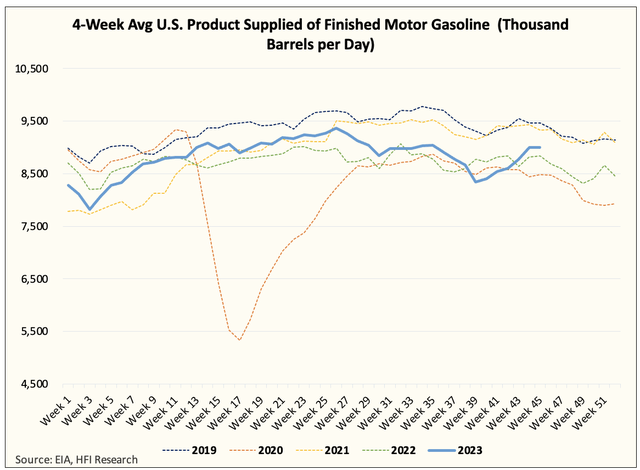
According to GasBuddy, U.S. gasoline demand fell over the past two weeks, while EIA is reporting 9.492 million b/d for Nov 3 week.
For the total demand picture, things are flat, but the volatility appears to be in the different segments.
EIA, HFIR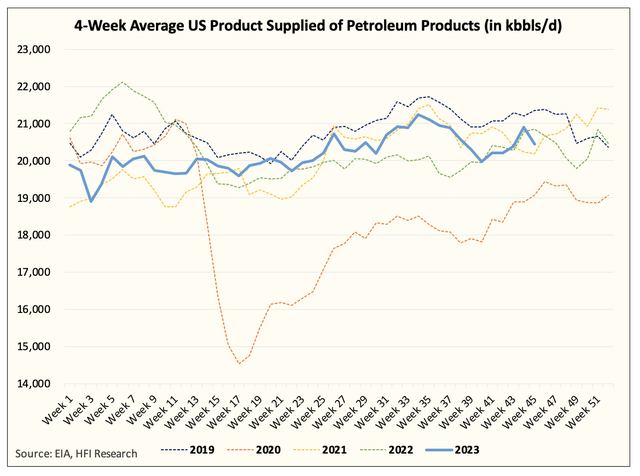
Categories
EIA, HFIR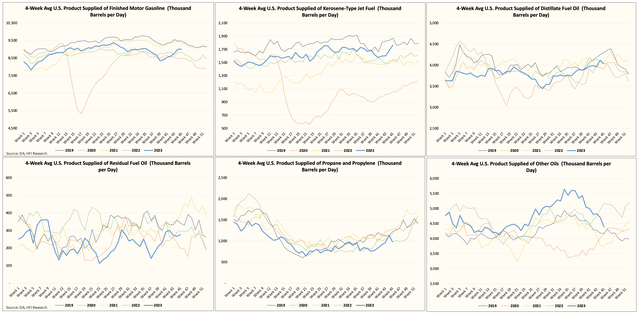
Now if you take a step back and look at the whole picture, it was a boring picture. Product storage draws offset the crude build, so the end result was that storage came in flat.
EIA, HFIR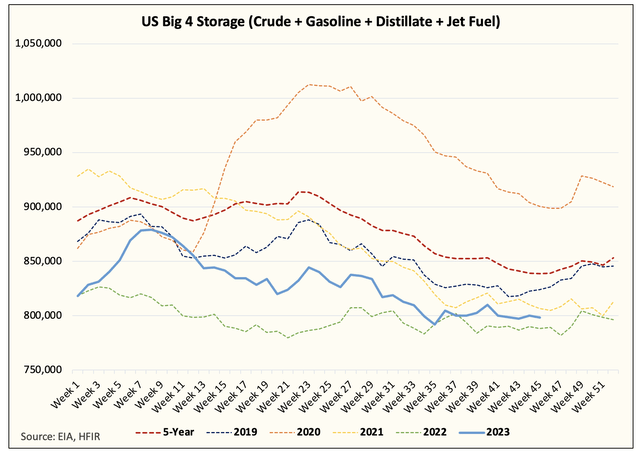
Crude
EIA, HFIR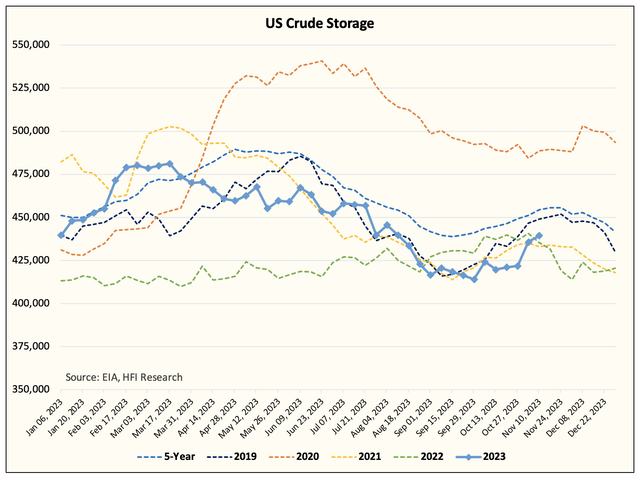
Products
EIA, HFIR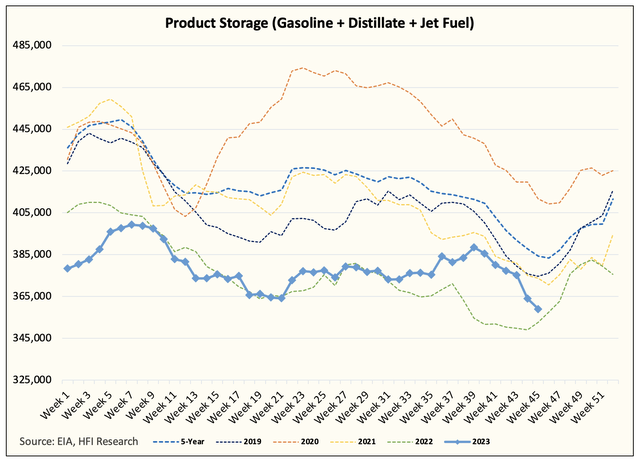
But in the hopes of better data quality going forward, we hope that the last two weeks were just an aberration.
Healing Period
The oil market is in a healing period. Refining margins are starting to recover as persistently low refinery throughput is prompting a larger-than-expected product draw.
Barchart.com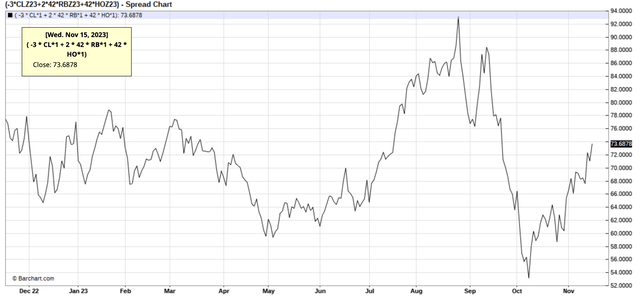
Timespreads remain lackluster as low refinery throughput prompts lower crude buying amid a balanced market.
Barchart.com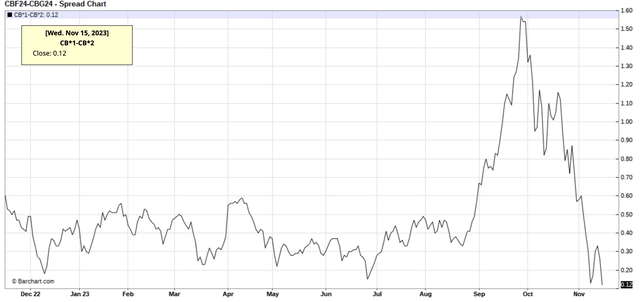
Sadly, even with the voluntary production cuts, the market is just balanced today. U.S. total liquids are the most transparent, so it’s the easiest way for the market to gauge the implied balance.
EIA, HFIR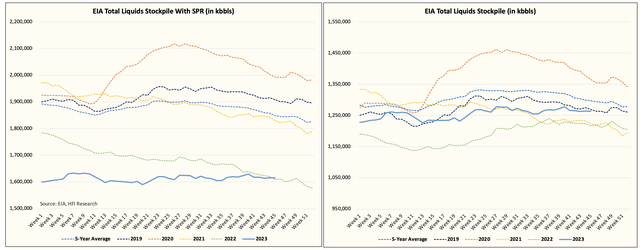
But as product storage decreases further and winter heating demand starts, refinery margins should continue to improve prompting higher buying down the road. If the Saudis agree to a voluntary production cut extension into 2024, then the backwardation should return, and flat prices should get an uplift.
All of this will take time, however, and EIA’s data quality over the last two weeks definitely didn’t help in swaying the market sentiment to the bull side. But we are confident the market is in the healing phase, and with time, prices will improve, and we should see WTI trade in the range of $80 to $95.
Read the full article here


