ETF Overview & Investment Thesis
The FT Cboe Vest Rising Dividend Achievers Target Income ETF (BATS:RDVI) seeks to provide investors with current income with a secondary objective of providing capital appreciation. The Fund seeks to deliver this objective by investing in securities contained in the Nasdaq US Rising Dividend Achievers Index and utilizing an option overlay strategy consisting of selling call options on the S&P 500 or ETFs that track the S&P 500.
RDVI has a target income level of 8% over the dividend yield of the S&P 500. The fund currently has ~$515 million in total net assets and charges an expense ratio of 0.75%. RDVI’s characteristics include a trailing P/E ratio of 8.9x and a 12 month distribution rate of 9.67%.
RDVI represents a fairly complex product which I believe should be avoided. Thus far, RDVI has performed poorly relative to the S&P 500 on both an absolute basis and a relative basis. I expect this to continue going forward due to the large underweight in technology stocks, high management fee, and limited upside due to the sale of at-the-money S&P 500 call options.
Investment Strategy Overview
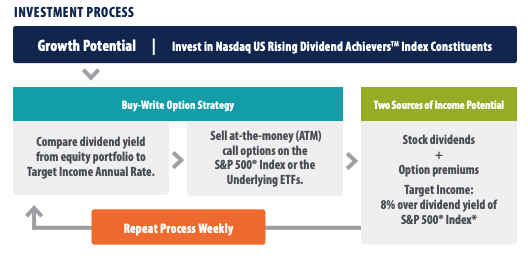
The first part of RDVI’s strategy involves buying the equities contained in the Nasdaq US Rising Dividend Achievers Index. This index consists of 50 U.S. exchange-traded equity securities including ADRs with a history of raising their dividends while exhibiting the characteristics to continue to do so in the future including strong cash balances, low debt and increasing earnings. The individual security weightings are actively managed by RDVI’s portfolio managers.
The second part of RDVI’s strategy involves selling call options on the S&P 500 Index. Each week, RDVI portfolio managers compare the dividend income of equity securities held against the target distribution of the fund and look to bridge the difference with premiums from selling call options. Call options written by RDVI have expirations of less than 30 days and are typically written at-the-money.
I believe there are a few key weaknesses to this approach:
Equity Exposure Is Based On Dividend Yield Of Portfolio
The result of this two pronged strategy is that the level of uncovered equity risk each week is dependent on the level of dividends of the rest of the portfolio. As of October 31, 2023 RDVI has an average monthly option overwrite % of ~11% and an average monthly upside participation rate ~89%. However, the degree of net equity exposure will fluctuate overtime.
Mismatch Between Underlying Holdings & Call Option Underlying
Typically most call write strategies sell calls against an underlying long position. However, for RDVI this is not the case as the fund is selling S&P 500 calls but owns a portfolio of securities which is very different from the S&P 500. The result of this is any divergence in performance could be magnified.
For example, consider a case where the S&P 500 rises by 5% over a short period of time and the underlying equities in RDVI fall by 2% over a short period of time. In this scenario, the call selling was a negative contributor to relative performance while equity security selection was also a negative driver of performance.
Selling S&P 500 Call Has Become A Crowded Trade
I believe selling calls has become a crowded trade given the number of ETFs that have come to market with strategies that look to sell calls to generate additional income. The result of this is that option premiums for calls are lower than they otherwise would be and selling them does not make a lot of sense. While there may still be a small positive expected value to selling call options, I believe this amount is more than offset when significant fees are charged at the fund level, which is the case with RDVI.
First Trust
High Management Fee
RDVI has an expense ratio of 0.75%. To put that into context, the average expense ratio for an actively managed equity mutual fund is ~0.66% and the average equity ETF expense ratio is ~0.16%. Comparably, the Global X S&P 500 Covered Call ETF (XYLD) charges a total expense ratio of 0.60%. Thus, RDVI appears to be priced towards the higher end of the range for similar products.
While 0.75% does not seem like much, it is very large in the context of expected equity annual returns of ~9%-10%. Moreover, RDVI is a somewhat lower risk strategy due to call selling which likely reduces the expected return of the fund and increases the fee cost as percentage of expected return.
Weak Historical Performance
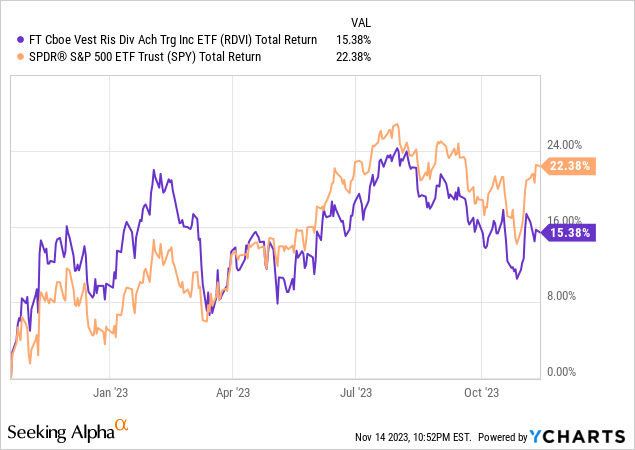
RDVI launched in October 2022 and thus the fund has a relatively limited performance history. However, RDVI has posted weak performance thus far. Since inception, RDVI has delivered a total return of 15.4% compared to a total return of 22.4% delivered by the S&P 500.
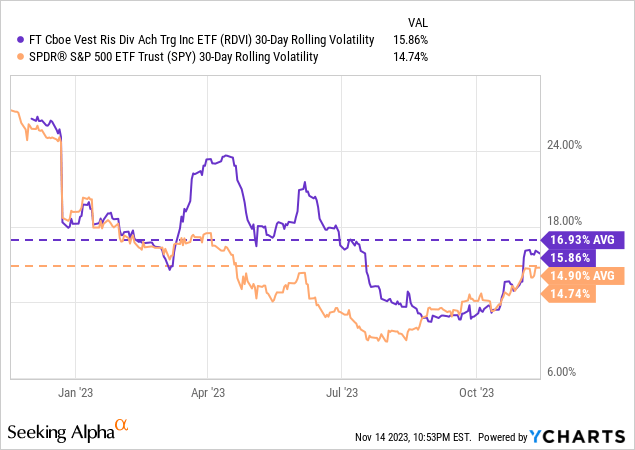
In addition to underperforming the S&P 500, RDVI has also experienced a higher level of average volatility. As shown by the chart below, RDVI has experienced an average 30 day volatility of 16.93% compared to 14.9% for the S&P 500.
Holdings Analysis
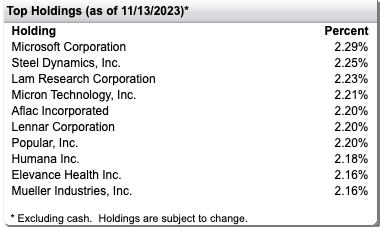
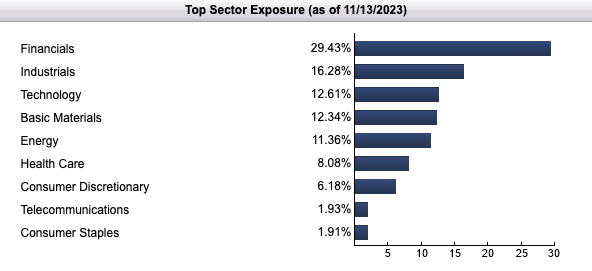
As shown below, RDVI is well diversified with the largest holding Microsoft (MSFT) accounting for just 2.29% of the fund. In terms of sector exposure, RDVI is very overweight financials which account for 29.4% of the fund. Comparably, financials make up just 12.8% of the S&P 500. RDVI’s largest underweight relative to the S&P 500 is technology. Technology accounts for 12.5% of RDVI compared to 28.5% of the S&P 500.
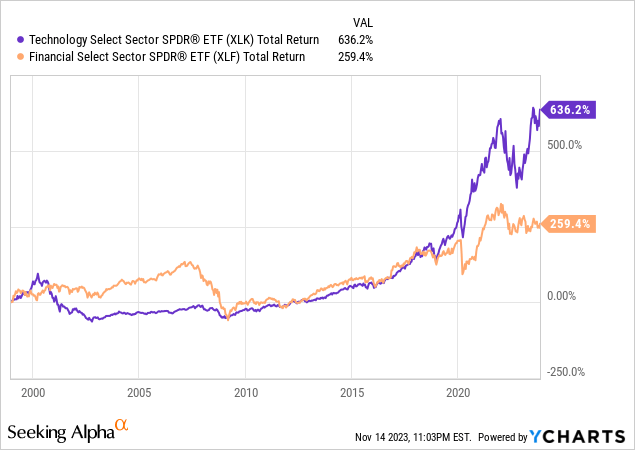
The large overweight to financials and underweight to technology is concerning to me as technology stocks have significantly outperformed financials stocks over both recent and long-periods of time. My view is that companies such as Microsoft, Apple, Alphabet, Amazon, Meta, and others represent highly attractive investments going forward due to their competitive advantages and growth potential.
First Trust
First Trust
Forward Looking Outlook
I believe RDVI will continue to deliver weak risk-adjusted performance going forward. Part of this view stems from the fact that I believe the option market supply and demand dynamics will continue to make selling calls a less attractive trade going forward than historical back testing would suggest. Another part of my view is that technology stocks are set to significantly outperform financials going forward.
The fact that RDVI sells S&P 500 calls against a different portfolio of underlying stocks has the effect of increasing the magnitude of potential underperformance to the extent the RDVI equity holdings underperform the S&P 500.
Finally, I also believe RDVI’s relatively high management fee of 0.75% will serve as a substantial performance headwind going forward.
Conclusion
RDVI is a complex product which includes an actively managed equity portfolio and S&P 500 call selling. Total equity exposure is in effect driven by the level of yield in the portfolio as this determines how many S&P 500 calls the fund needs to sell in order to meet its income objective.
Thus far, RDVI has performed very poorly relative to the S&P 500 on both an absolute basis and a relative basis. I expect this to continue going forward due to the large underweight in technology stocks, high management fee, and reduced upside from the sale of S&P 500 call options.
For this reason, I rate RDVI a sell and believe investors would be better served investing in traditional index products such as SPDR S&P 500 ETF Trust (SPY).
Read the full article here


