Introduction
Recently, I took a fresh look at home improvement giant The Home Depot, Inc. (HD) and found the stock to be a pretty good buy below $300 – assuming a long-term investment horizon. The stock reacted to the third quarter results with a jump in price – at least it seemed that way. Favorable inflation readings pushed the broader market higher on the same day, so it’s only reasonable to attribute a (significant) portion of HD stock’s rise that day to this development.
The stock of smaller competitor Lowe’s Companies (NYSE:LOW) also benefited from the improved sentiment last week. However, in an initial reaction to the third quarter earnings report today, LOW gave up some of its previous gains. Since it’s been a while since I last looked at Lowe’s stock, and especially in light of what looks like a surprisingly poor earnings report, it’s a good time to take a fresh look at the company. In addition to my take on Lowe’s Q3 FY2023 results, I’ll also present an updated valuation and share whether I’m currently a buyer of LOW stock, in which I currently hold a similar sized position as I do in Home Depot stock.
Lowe’s Q3 – Really A Bad Quarter?
For the third quarter of fiscal 2023, Lowe’s reported earnings per share (EPS) of $3.06, slightly above the latest consensus estimate of $3.03, but 6% below the third quarter fiscal 2022 results. No adjustments were made to the third quarter fiscal 2023 results.
Quarterly sales were slightly lower than expected at $20.5 billion, which corresponds to a year-over-year decline of almost 13%. However, investors should not take the double-digit decline in sales at face value, as the comparison is distorted by the sale of the Canadian business in November 2022. On a like-for-like basis, net sales fell by 7.4%, mainly due to weaker consumer disposable income. Considering that competitor HD reported a decline in comparable sales of only 3.1%, it is understandable that the market reacted negatively to Lowe’s’ report.
However, management also announced a fairly significant (considering we’re already pretty close to the end of Lowe’s fiscal year) reduction in sales guidance. For the full year, the company now expects net sales of $86 billion (down from the previous midpoint of $88 billion) and a 5% year-over-year decline in comparable sales (down from the previous midpoint guidance of -3.0%). This is particularly disappointing because competitor Home Depot has only narrowed its comparable sales guidance, but has maintained the midpoint of -3.5%. As I wrote in my March 2023 comparative analysis, Lowe’s continues to lag Home Depot in comparable sales growth (or lack thereof). I attribute this largely to the smaller competitor’s greater exposure to retail customers (75% of net sales are generated with DIY customers). Put differently, Lowe’s is more of a barometer of the financial health of the end consumer than Home Depot (see fiscal 2020 performance in Figure 1, for example).
Looking at Lowe’s Companies’ latest results, the weakness in consumer spending is also evident in the disproportionate decline in comparable sales for more expensive purchases (e.g. -9.8% for purchases over $500 versus -5.7% for purchases under $100). However, this was to a certain extent to be expected, as larger purchases often involve durable goods such as household appliances, which are likely to be postponed when disposable income is tight.
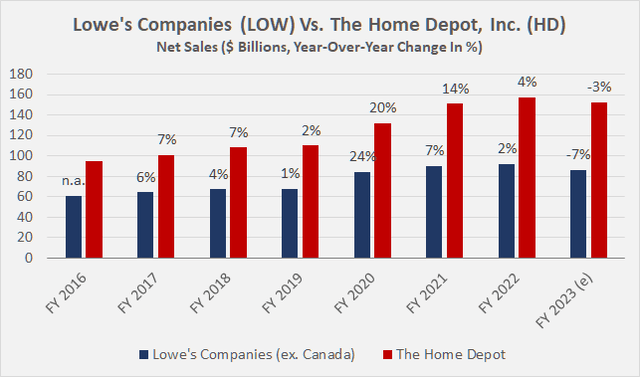
Figure 1: Lowe’s Companies (LOW): Net sales growth compared to The Home Depot, Inc.; LOW sales were adjusted for the Canada segment which was sold in November 2022 (own work, based on company filings)
However, a look beyond the arguably weak sales guidance underscores the solid track record of Lowe’s Companies. Gross margin is now nearly on par with competitor Home Depot, whose trailing twelve-month (TTM) gross margin declined 32 basis points (Figure 2). Lowe’s disciplined cost management is also evident from the perspective of relative TTM selling, general and administrative (SG&A) expenses, which decreased by approximately 200 basis points compared to fiscal 2021 (comparison to fiscal 2022 is not meaningful, -1,100 basis points). Home Depot saw an increase in its relative SG&A expenses, both on a sequential basis (compared to fiscal 2022) and on a two-year basis (Figure 3).
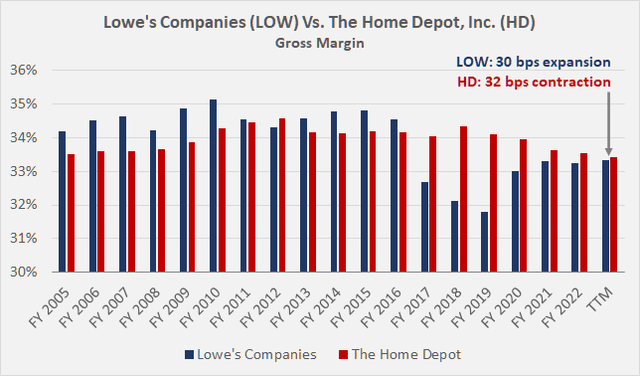
Figure 2: Lowe’s Companies (LOW): Gross margin compared to The Home Depot, Inc. (own work, based on company filings)
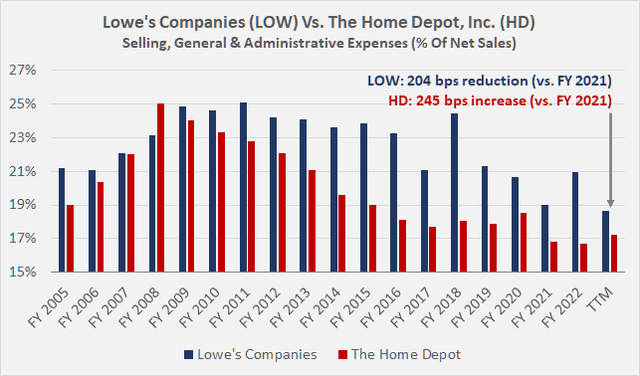
Figure 3: Lowe’s Companies (LOW): Selling, general and administrative expenses in percent of net sales compared to The Home Depot, Inc. (own work, based on company filings)
The improved gross margin and disciplined SG&A expenses translate to a TTM operating margin of 12.8% (GAAP basis), which is still significantly below HD’s TTM margin of 14.5%, but still an improvement compared to fiscal 2021. Compared to the previous adjusted operating margin guidance (midpoint of 13.5%) and especially the original guidance when presenting the full year 2022 results (mean margin of 13.7%), management’s further lowered margin guidance of 13.3% was somewhat disappointing, but is definitely a solid figure in what remains a challenging environment.
In terms of free cash flow, fiscal 2023 year-to-date looks weaker than the previous year, mainly due to working capital effects. Additions to inventories are significant (+$1.0 billion year-to-date), but still reasonable and comparable to Home Depot. Free cash flow was also negatively impacted by a $2.7 billion decline in accounts payable and other operating liabilities, the latter of which was not detailed, so it’s important to take a close look at the upcoming 10-Q filing. Still, analysts (according to FactSet/FAST Graphs) expect free cash flow per share growth of 38% year-over-year, though the impact of share repurchases and a one-time “benefit” due to last year’s significant working capital overhang must be taken into account.
Looking at growth at the company level, i.e. excluding the benefit from share buybacks, free cash flow growth in 2023 is more likely to be around 27%. This is of course still a very strong upswing, but I think it is important to consider the significant expected working capital-related benefit this year. The decline in free cash flow adjusted for working capital (red bars in Figure 5) illustrates this well.
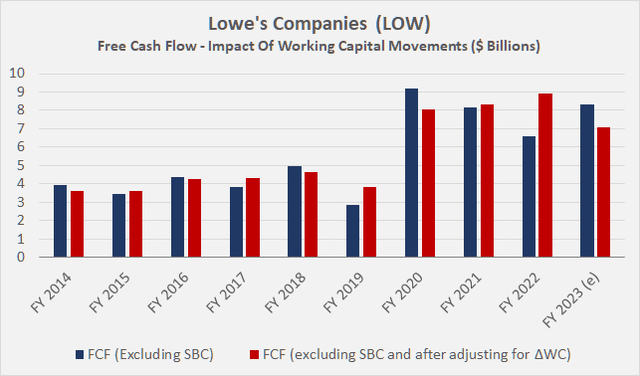
Figure 4: Lowe’s Companies (LOW): Free cash flow, impact of working capital movements (own work, based on company filings)
Due to the working capital-related effects, it is not surprising that Lowe’s had to take on additional debt to finance dividends and share buybacks ($7.8 billion since the beginning of the year). As of November 3, 2023, Lowe’s net debt (including operating leases) amounted to $38.5 billion, $4.0 billion more than a year ago. This corresponds to a leverage ratio of 4.7 times the average adjusted free cash flow of the last three years (read here why I prefer net debt in terms of free cash flow as a leverage metric). Excluding operating leases, Lowe’s Companies’ leverage ratio is somewhat more modest at 4.2 times free cash flow (net debt of $34.4 billion). While the increase in net debt sounds worrying, it is only reasonable to expect a moderation at the end of the year, as explained above. This is also reflected in the temporary weakness in inventory days, which can be expected to normalize going forward (TTM number in Figure 5).
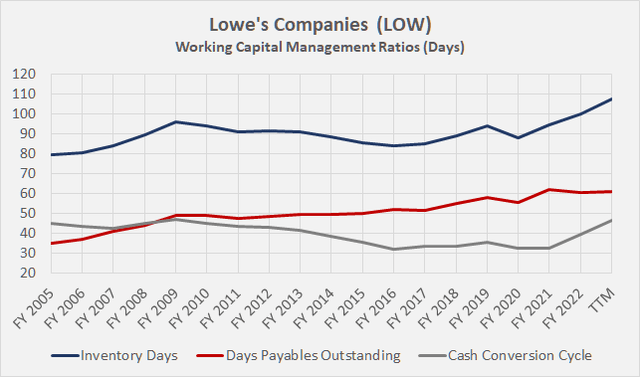
Figure 5: Lowe’s Companies (LOW): Working capital management ratios (own work, based on company filings)
Updated LOW Stock Valuation
At the current price of $199, LOW stock trades at a blended price-to-earnings ratio of 15, comparatively cheap given its long-term average earnings growth of 13% per year. However, I think Lowe’s, like The Home Depot, has benefited greatly from the post-GFC low interest rate environment and the resulting housing boom. As a result, I expect growth to be much more modest in the future. Nevertheless, I believe that both companies will benefit from a tight housing market and the associated demand for renovations and home improvement work. If the stock maintains a 15x earnings multiple through 2025 and analyst estimates are accurate, investors can expect an annualized total return of 9% – not great, but not bad either (Figure 6).
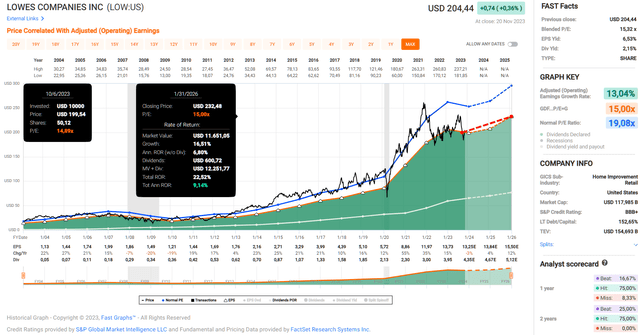
Figure 6: Lowe’s Companies (LOW): FAST Graphs chart, based on adjusted (operating) earnings per share (FAST Graphs)
Looking at other multiples and taking into account the ten-year average of historical valuations, Lowe’s stock appears fairly valued today (Figure 7), although the favorable interest rate environment since the Great Recession and especially since the pandemic must be taken into account. That being said, and even though interest rates are currently expected to remain elevated for a longer period of time, one should keep in mind the historically high level of government debt (Figure 8) and the resulting limited room for maneuver in the context of high interest rates. At some point, interest rates will have to come down again.
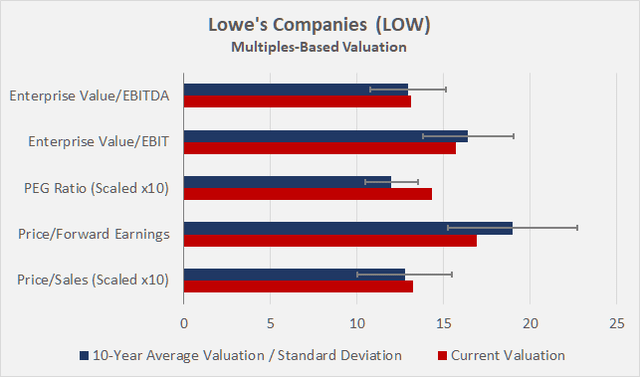
Figure 7: Lowe’s Companies (LOW): Multiples-based historical valuation (own work, based on data from Morningstar)
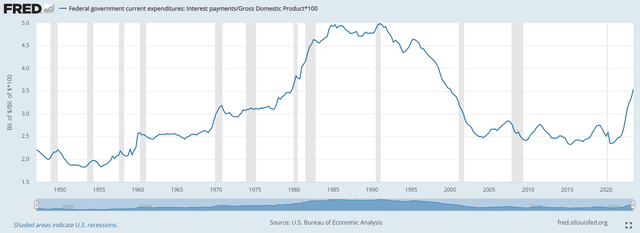
Figure 8: U.S. interest expense in percent of GDP, A091RC1Q027SBEA/GDP*100 (U.S. Bureau of Economic Analysis, retrieved from FRED, Federal Reserve Bank of St. Louis)
Since discounted cash flow (DCF) analyses are notoriously sensitive to the input parameters and it is impossible to predict long-term cash flow growth, I have performed a highly simplified DCF analysis (Figure 9). In principle, it is based on Lowe’s Companies blended free cash flow, i.e. the average free cash flow for fiscal 2021 and 2022, including the expected free cash flow for fiscal 2023. Figure 9 shows the sensitivity of Lowe’s valuation to the cost of equity and the perpetual growth rate. I wouldn’t read too much into the results – in a nutshell, the stock is a buy at $200 if two conditions are met: The investor is comfortable with a cost of equity of 9.4% (derived from the Capital Asset Pricing Model) and Lowe’s can grow its free cash flow by 2% to 3% annually in perpetuity. I don’t think this is a particularly demanding valuation, especially given the comparatively high risk-free interest rate (which impacts the cost of equity).
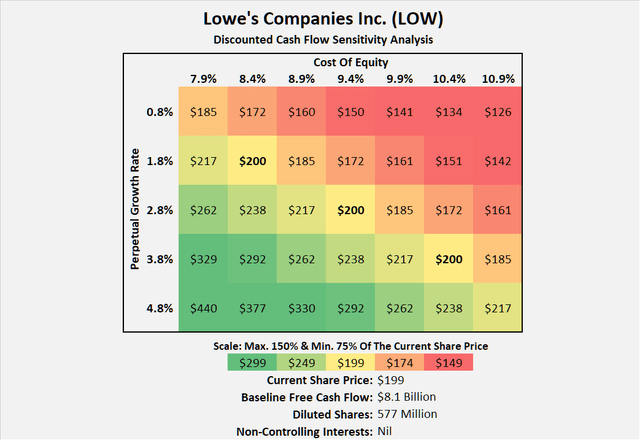
Figure 9: Lowe’s Companies (LOW): Discounted cash flow sensitivity analysis (own work, based on company filings and own calculations)
Conclusion
Lowe’s Companies reported somewhat disappointing results for the third quarter of fiscal 2023, but more importantly for the full year as well. With just over two months left in the fiscal year, I was a bit surprised to see the sales guidance cut quite a bit. This once again shows that the company is much more focused on DIY customers (currently around 75% of sales) than its larger competitor The Home Depot.
The reported year-over-year decline in net sales, however, should not be over-interpreted as Lowe’s Canada business was still partially included in the third quarter fiscal 2022 results. The adjusted sales decline was significantly less severe, but still worse than Home Depot’s Q3 results. However, Lowe’s continues to focus on the professional customer segment, which again achieved positive comparable sales.
More important than the disappointing (but partly expected) sales figure and guidance update is that the company is making good progress from a profitability perspective. Gross margin has improved in a still challenging environment and management is showing good cost discipline. Overall, profitability still lags Home Depot (which is only reasonable given the difference in scale), but Lowe’s is making good progress and may eventually close the profitability gap (Figure 10). Importantly, the same is true for cash profitability, which is in the high single digits and about a percentage point below Home Depot.
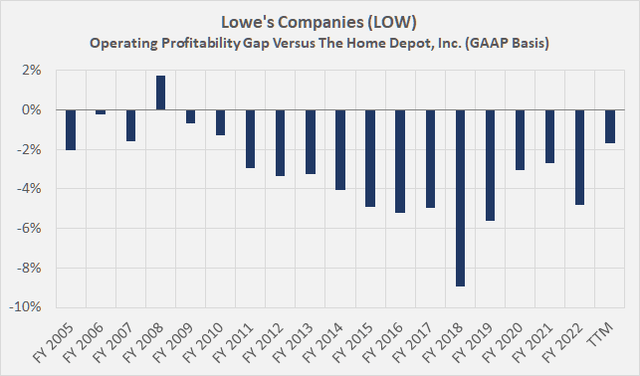
Figure 10: Lowe’s Companies (LOW): Operating profitability gap versus The Home Depot, Inc. (own work, based on company filings)
At $200 and a blended price-to-earnings ratio of 15, Lowe’s stock is quite a bit cheaper than its larger (and arguably better-performing) competitor Home Depot. On a comparable basis, I think the valuation difference is justified, but if Lowe’s management can close the profitability gap with Home Depot over time, there’s plenty of room for upside. But even if the fundamentals remain as they currently are, the return prospects are still acceptable, assuming a long investment horizon. That said, I don’t think there is a significant margin of safety at $200, so I’m definitely not an aggressive buyer of LOW’s stock at this level. However, if I didn’t already have a modest position in the stock (currently 0.8% of portfolio value), I would probably buy an initial tranche at this level and then gradually add to it. Hence, I rate the stock a cautious “buy”.
Thank you for taking the time to read my latest article. Whether you agree or disagree with my conclusions, I always welcome your opinion and feedback in the comments below. And if there’s anything I should improve or expand on in future articles, drop me a line as well. As always, please consider this article only as a first step in your own due diligence.
Read the full article here


