Nobody thinks of Thanksgiving here in the United States and expects to be healthy.
At least nobody that I know of associates the two together. Maybe you run with a more mature crowd than I do.
Thanksgiving tends to be a time of intense feasting: thick carvings of turkey with sides like stuffing (or filling or dressing), butter-saturated mashed potatoes and gravy, candied yams, green bean casserole, cranberry sauce, dinner rolls, and cornbread.
Then, after you’re done with all that, you still try to make room for dessert. Would you like a big or little slice of pumpkin pie?
Pecan pie?
Sweet potato pie?
Apple pie? A la mode?
Maybe a small slice of each?
By the time you’re done, you’re lucky if you can fit in the car for the ride home or your annual Black Friday trip, much less zip up your zipper.
Looking at the common menu, I think it’s mostly carbs. Or maybe fat? Regardless, there’s a lot of carbs and fat involved. That and sugar.
Meaningful amounts of fruits and veggies are in short supply – hardly nutrition that should be encouraged all year long. Though I guess once or twice a year won’t kill us.
That’s not something that can be said about investing though. You always want that intake to be properly balanced. That’s why I recommend stocking up on real estate investment trusts, or REITs, like the ones in this article, along with a healthy portion of other investments.
The Food Pyramid Was Really Bad Advice
I hope I didn’t ruin your Thanksgiving with that intro. Truly, go ahead and enjoy your meal.
As long as you commit to eating healthy again afterward, I’m sure your pants will fit again soon enough.
Besides, that food pyramid we all grew up with is all wrong anyway.
PBS detailed that as far back as January 2015, when it published “Revisiting the Evils of the Food Pyramid.” It shows this classic image:
PBSlocal.org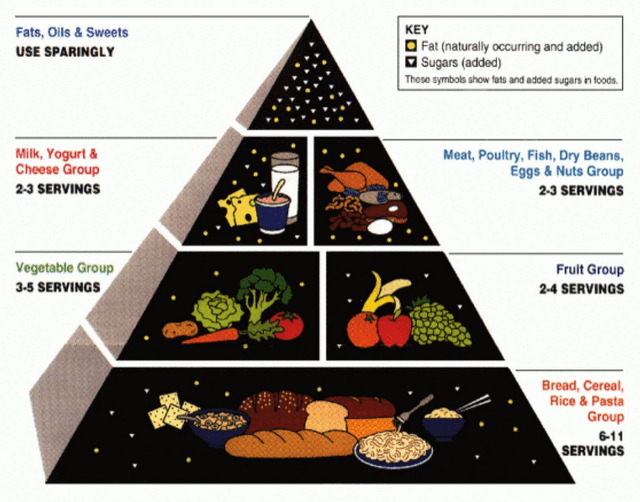
Then it explains:
“The concept’s simple to understand: Eat a lot of what’s on the bottom and a few of what’s on top. But a lot of nutritionists quickly saw this was doing more harm than good. Harvard professor Walter Willett was one of the first professionals to rail against it. His argument – along with other nutritionists – went like this:
- All fats are not bad. In fact, some are essential and shouldn’t have their impact diminished
- Not all protein is created equally, and it is critical to distinguish that.
- Not all complex carbohydrates are healthy, and eating 6-11 servings of it a day is certainly not.
- An entire section of milk is not essential and won’t work for those with a lactose intolerance.
- Meat is not a necessity.
- A pyramid based on actual science would have vegetables as its base.
- It probably should say something about vitamin intake.
“Other than that, great work everyone!”
PBS also notes how Luise Light, the USDA director responsible for the pyramid, eventually stated that meat and milk lobbies were very influential in creating the pyramid. That’s why, for instance, the bread recommendation is so big – “to make the wheat growers happy.”
That’s why it concludes, “If you want to keep the American diet moving in the right direction, the solution is simple: Lock out the lobbyists.”
You Need a More Diversified Investment Intake Too
In case you need to know, PBS isn’t the only source that’s trashed the food pyramid – which, incidentally, doesn’t exist at all anymore.
Scientific American reported almost a decade earlier that:
“Even when the pyramid was being developed… nutritionists had long known that some types of fat are essential to health and can reduce the risk of cardiovascular disease. Furthermore, scientists had found little evidence that a high intake of carbohydrates is beneficial. After 1992 more and more research showed that the USDA pyramid was grossly flawed.”
Today, the prevalent push is much more toward portion control. Know what you’re eating and how much of it.
The same basic concepts apply when you’re trying to put together a healthy, balanced investment portfolio. You want an intelligently diversified and personalized spread of holdings.
Other than Warren Buffett – who works with an excellent network of contacts and resources – I can’t think of anyone meaningful who disagrees.
Earlier this year, Forbes recommended these six steps:
- Start with your goals and time horizon.
- Understand your risk tolerance.
- Match your account type with your goals.
- Select investments [based on the previous steps, including]:
- Stocks
- Bonds
- Funds
- Alternative investments
- Cash and cash alternatives.
- Create your asset allocation and diversify
- Monitor, rebalance, and adjust.
When you include REITs as a blend of stocks and alternative investments, it adds a layer of nutrients that you can’t get elsewhere. And while I can’t promise it will taste as amazing as that apple pie in the moment…
It should satisfy you for quite a lot longer than a mere Thanksgiving haze, offering something to be grateful for years to come.
A Balanced Meal You Can Eat Through Retirement.
Realty Income Corporation (O)
Realty Income is a net-lease REIT with a market cap of approximately $38.53 billion and a 262.6 million square foot portfolio which is comprised of around 13,200 single-tenant, free-standing commercial properties that are triple-net leased to more than 1,300 tenants located across all 50 states, the United Kingdom, Spain, Italy, and Ireland.
Realty Income primarily invests in retail properties but has been expanding its portfolio diversification with industrial and gaming properties. Roughly 82.6% of their annual rent comes from retail properties, 13.1% comes from industrial properties, and 2.6% comes from gaming properties.
At the end of the third quarter, Realty Income reported a physical occupancy of 98.8% with a weighted average lease term (“WALT”) of almost 10 years. Realty Income is an S&P 500 (SP500) company that was formed in 1969 and was publicly listed in 1994.
Over its 54-year operating history, the company has become very well known for its monthly dividend and is an S&P 500 Dividend Aristocrat.
Since its IPO in 1994, Realty Income has declared 640 monthly dividends and has increased its dividend for 104 consecutive quarters, and for 29 consecutive years at a compound annual growth rate (“CAGR”) of 4.3%, making it one of the most consistent and dependable dividend payers available in the market.
O – IR
Over the last year, Realty Income has been busy on the acquisition front. At the end of 2022, they closed the previously announced acquisition of Encore Boston Harbor Resort in a sale-leaseback transaction with Wynn Resorts which marked their first acquisition in the gaming industry.
In March of this year, Realty Income entered into an agreement with EG Group to acquire 415 convenience stores which are heavily concentrated in Massachusetts, New York, and Florida.
In August, Realty Income increased its gaming exposure with a $950 million investment in the Bellagio Las Vegas and further diversified its portfolio in November by acquiring an 80% equity interest in 2 data centers through a JV with Digital Realty (DLR).
Most notable so far in 2023 is Realty Income’s acquisition of Spirit Realty (SRC) in a $9.3 billion all-stock transaction. The SRC acquisition is leverage-neutral and is expected to add more than 2.5% accretion to Realty Income’s adjusted funds from operations (“AFFO”), expand their property count from approximately 13,000 to 15,182, and increase their industrial properties as a percentage of their total portfolio from 13.1% to 15.1%.
O – IR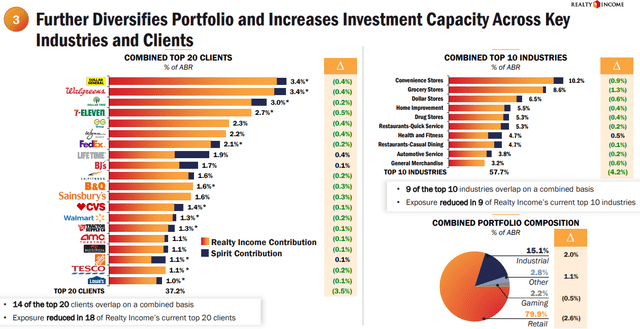
Realty Income may very well be the most dependable and consistent publicly traded REIT. The triple-net REIT doesn’t have the fastest growth rates but has still delivered a solid 5% median AFFO growth rate since 1996 and has delivered positive AFFO growth in 26 out of the last 27 years.
Over the last 10 years, Realty Income has had a blended average AFFO growth rate of 6.09% and an average dividend growth rate of 5.76%. The company pays a 5.77% dividend yield that is well covered, with an AFFO payout ratio of 75.69% and is currently trading at a discount.
Realty Income is currently trading at a P/AFFO of 13.33x, which is a sharp discount to their 10-year average AFFO multiple of 18.86x.
We rate Realty Income a Buy.
FAST Graphs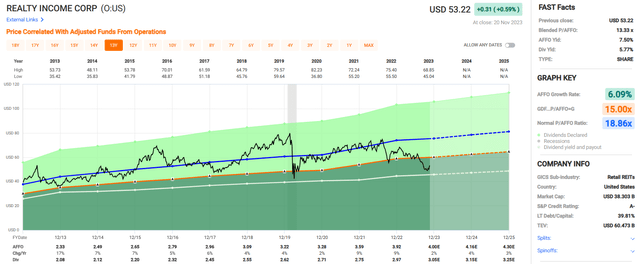
VICI Properties Inc. (VICI)
VICI Properties is a gaming REIT with a market cap of around $29.59 billion and a 125 million square foot portfolio that includes top gaming, hospitality, and entertainment destinations which are leased to industry-leading operators on a triple-net basis.
VICI specializes in experiential real estate and owns multiple trophy properties on the Las Vegas Strip including Caesars Palace, the Venetian Resort, and MGM Grand.
In total, VICI owns 92 experiential properties consisting of 54 gaming properties that feature over 60,000 hotel rooms, roughly 500 retail outlets, and approximately 500 bars, restaurants, sportsbooks, and nightclubs.
In addition to their core gaming properties, VICI’s portfolio also includes 38 non-gaming experiential properties. These primarily consist of the bowling alley properties recently obtained through the Bowlero Corp. (BOWL) acquisition.
Additionally, VICI owns 4 championship golf courses and more than 30 acres of undeveloped land located next to the Las Vegas Strip.
VICI – IR
Since its IPO in 2018, VICI has grown at a rapid clip, with the gaming REIT achieving investment-grade credit ratings and S&P 500 inclusion by 2022, just several years after the company first went public.
Additionally, over this time period, VICI grew its adjusted EBITDA from $722 million in 2018, to approximately $2.9 billion when annualizing its third quarter’s earnings in 2023.
VICI’s growth in large part has been due to its large acquisitions including the $4.0 billion acquisition of the Venetian Resort and the $17.2 billion acquisition of MGM Growth Properties in 2021.
More recently, in 2023 VICI expanded its geographical footprint with its first gaming investments in Canada and broadened its property mix with the acquisition of Bowlero.
VICI – IR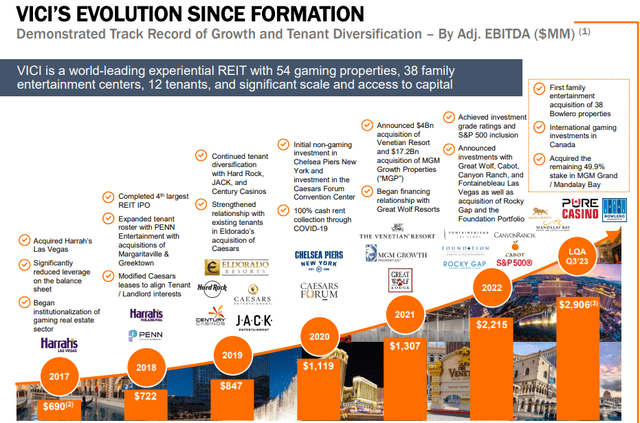
Since its formation, VICI has raised their dividend each year while maintaining a conservative AFFO payout ratio.
From the third quarter of 2018, when they paid a quarterly dividend of $0.2875, to the third quarter of 2023, when they paid a quarterly dividend of $0.415, VICI has delivered a compound annual dividend growth rate of 7.6% since its IPO.
Since 2019, VICI has delivered an average AFFO growth rate of 7.23%, and analysts expect AFFO per share to increase by 11% in the current year and by 5% in 2024.
VICI currently pays a 5.80% dividend yield that is well covered with an AFFO payout ratio of 77.72% and trades at a P/AFFO of 13.46x, which compares favorably to their average AFFO multiple of 16.29x.
We rate VICI Properties a Buy.
FAST Graphs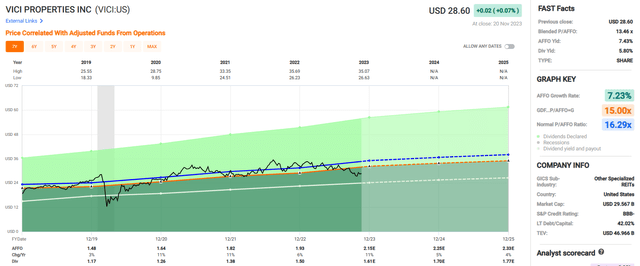
Alexandria Real Estate Equities, Inc. (ARE)
Alexandria Real Estate is a life science REIT with a market cap of roughly $18.16 billion and a 75.1 million square foot portfolio comprised of 41.5 million rentable square feet of operating properties, 14.5 million SF of properties under construction or in development, and 19.1 million SF set aside for future development.
Alexandria has been leading the way in the life science real estate niche since its founding in 1994. They specialize in the development, ownership, and operation of collaborative life science properties in AAA innovation cluster locations in key markets including Boston, New York City, San Francisco, San Diego, Seattle, Maryland, and the Research Triangle.
Alexandria’s laboratory space is leased by more than 800 tenants including well-respected names such as Moderna, Bristol-Myers, Merck, Harvard, and the Massachusetts Institute of Technology.
ARE’s portfolio is well diversified by tenant with their largest tenant only making up 3.3% of their annual rental revenue and their 20 tenants combined only making up 32.4%.
During its latest earnings release, ARE reported a 93.7% occupancy rate for its operating properties with a weighted average remaining lease term of approximately 7 years.
ARE – IR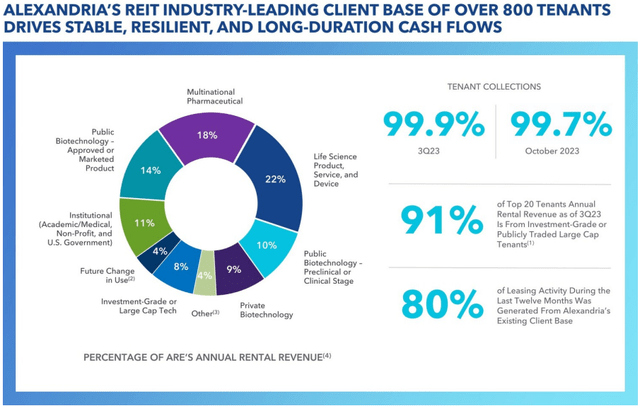
Since the Covid lockdowns ended and the “work-from-home” movement began, REITs in the office sector have sold off significantly. Alexandria has been no exception, as the stock has fallen by approximately -30% over the last year.
While ARE is technically an office REIT, it is much more accurate to describe it as a life science REIT where multinational pharmaceutical and biotechnology companies lease lab space to perform research and development. Many of the tasks performed at ARE’s properties are regulated and cannot be done from home.
Unlike traditional office buildings, ARE’s properties are filled with researchers and scientists who cannot perform experiments and formulate drugs from their kitchens.
While many office REITs have been suffering due to occupancy declines, when annualized, ARE’s third quarter leasing volume of 867,582 rentable square feet is in line with their annual historical average.
Additionally, during the third quarter ARE achieved rental rate increases of 28.8%, or 19.7% on a cash basis, and the leases signed during 3Q 23 had weighted average lease terms of 13.0 years.
ARE – IR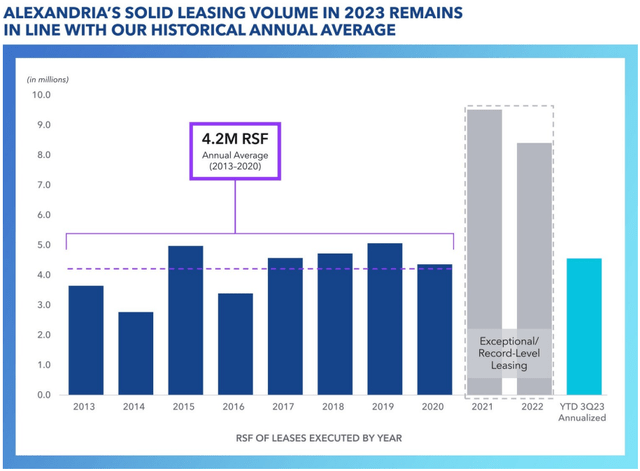
Alexandria has an investment-grade balance sheet and excellent debt metrics including a net debt and preferred stock to adjusted EBITDA of 5.4x and a fixed charge coverage ratio of 4.8x.
Their debt is 99.0% fixed rate, with a weighted average interest rate of 3.70% and a weighted average term to maturity of 13.1 years, plus ARE has no debt maturing prior to 2025.
Over the last decade, ARE has delivered a blended average AFFO growth rate of 5.10% and an average dividend growth rate of 8.62%.
The company pays a 4.75% dividend yield that is well covered with an AFFO payout ratio of 72.17%, and currently the stock is trading at a P/AFFO of 14.73x, which is a significant discount when compared to their 10-year average AFFO multiple of 24.18x.
We rate Alexandria a Strong Buy.
FAST Graphs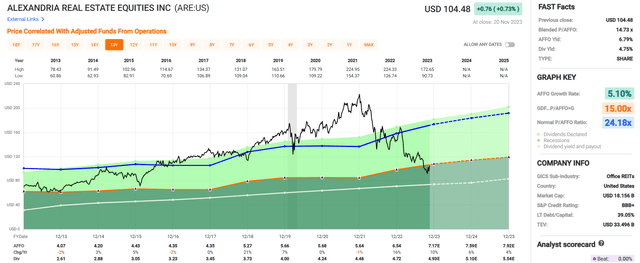
Extra Space Storage Inc. (EXR)
Extra Space is a self-storage REIT with a market cap of around $27.36 billion and a 279.0 million square foot portfolio that consists of 3,651 self-storage properties containing 2.5 million storage units that Extra Space owns and/or operates across 42 states and the District of Columbia.
After its merger with Life Storage (formerly LSI) in July, EXR has become the largest self-storage management company and the second largest owner and/or operator of self-storage properties in the United States.
Extra Space stores operate under several brands including Extra Space, Storage Express, and Life Storage, and offer secure storage facilities that include traditional storage, business storage, RV, and boat storage.
EXR wholly owns 52% of the portfolio, or 1,898 self-storage stores, has an interest in 471 stores through a JV, and manages 1,282 stores for third-party owners. Between their third-party managed and JV stores, Extra Space has a total of 1,753 self-storage properties under management.
As of the end of the third quarter, EXR reported a same-store occupancy rate of 94.1%.
EXR – IR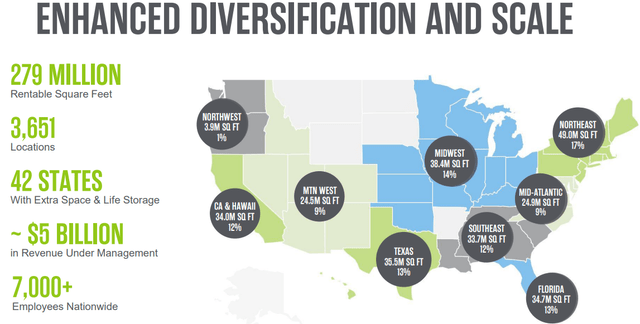
On November 7th, Extra Space released its third quarter operating results and reported total same-store revenues during the quarter of $397.9 million, compared to $390.6 million in the third quarter of 2022, representing an increase of 1.9%.
Funds from operations (“FFO”) came in at $348.5 million, or $1.69 per share during 3Q-23, compared to FFO of $308.7 million, or $2.16 per share during 3Q-22. Core FFO was reported at $415.8 million, or $2.02 per share, compared to Core FFO of $314.9 million, or $2.21 per share in the third quarter of 2022.
On a per share basis, the year-over-year change in Core FFO represents a decrease of approximately 8.6%. During the quarter S&P Global upgraded all of its ratings on EXR to BBB+ / stable and the company reported solid debt metrics including a net debt to EBITDA of 5.0x and a fixed charge coverage ratio of 4.3x.
EXR – IR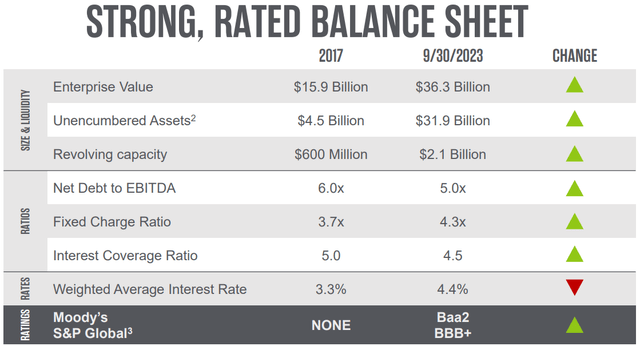
Over the last decade, Extra Space has delivered solid growth with a blended average AFFO growth rate of 13.47% and an average dividend growth rate of 22.96%. Analysts expect AFFO per share to fall by -5% in 2023, but then to increase by 4% in 2024 and by 6% in 2025.
It is worth noting that EXR’s AFFO per share increased each year from 2007 to 2022, with the exception of 2009 when AFFO per share fell by -15%. In every other year between 2007 and 2022 EXR delivered positive AFFO growth.
Currently, EXR pays a 5.00% dividend yield that is well-covered with an AFFO payout ratio of 73.98% and trades at a P/AFFO of 16.72x, which is a discount compared to their 10-year average AFFO multiple of 22.46x.
We rate Extra Space Storage a Buy.
FAST Graphs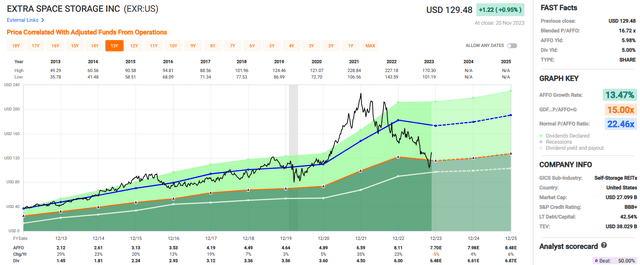
Rexford Industrial Realty, Inc. (REXR)
Rexford is an industrial REIT with a market cap of approximately $9.93 billion and a 45.0 million square foot portfolio that consists of 371 industrial properties located exclusively in infill Southern California (“SoCal”).
REXR engages in the acquisition, operation, and value-add redevelopment of industrial properties throughout the SoCal market. Rexford differentiates its investment strategy from other industrial REITs in that it has a singular focus on the infill SoCal market, which is the 4th largest industrial market in the world and the largest industrial market in the United States.
SoCal is such an attractive market due to its consistent supply & demand imbalance. Southern California has a vast economy made up of over 600,000 businesses and roughly 22 million residents, making the regional economy larger than most nations.
While demand for industrial properties in SoCal remains consistently high, there is limited supply of developable land due to natural barriers including mountains and oceans, as well as restrictive zoning regulations within the region.
As of the end of the third quarter, REXR had a stable base of 1,600 tenants and reported an average same property portfolio occupancy of 97.8%.
REXR – IR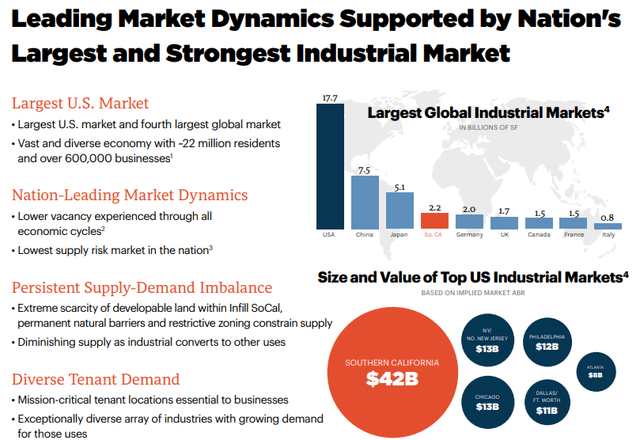
Rexford Industrial has an investment-grade balance sheet with a BBB+ credit rating from S&P Global and a Baa2 rating from Moody’s. The company has excellent debt metrics including a net debt to adjusted EBITDA of 3.7x, a net debt to total enterprise value ratio of 16.7%, and a long-term debt to capital ratio of just 24.23%.
All of REXR’s outstanding debt is fixed rate, with a weighted average interest rate of 3.6% and a weighted average term to maturity of 4.8 years. Plus, they have approximately $1.5 billion of liquidity and no significant debt maturities until 2026 including REXR’s 2024 term loan extension options.
REXR – IR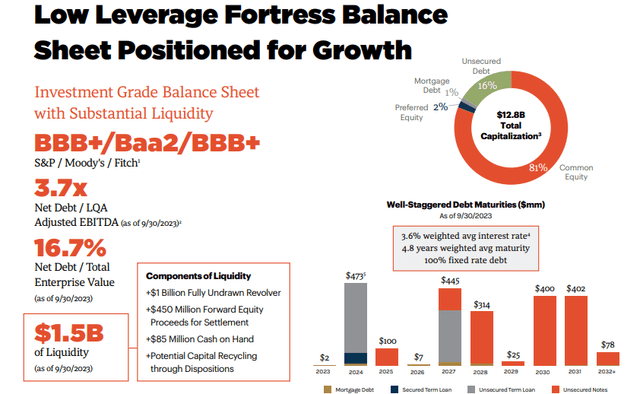
Since 2014, Rexford Industrial has delivered a blended average AFFO growth rate of 12.84% and has an average dividend growth rate of 13.08% over the last 8 years.
Analysts project strong earnings growth in the coming years with AFFO per share expected to increase by 10% in 2023, and then increase by 16% and 19% in the years 2024 and 2025 respectively.
Currently, REXR pays a 3.20% dividend yield that is well covered with an AFFO payout ratio of 80.25% and trades at a P/AFFO of 27.87x, which is a significant discount when compared to their average AFFO multiple of 35.54x.
We rate Rexford Industrial Realty a Strong Buy.
FAST Graphs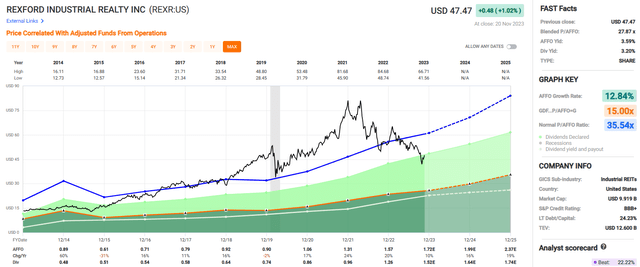
I’m Thankful for YOU!
As you may know, I’m the most-followed writer on Seeking Alpha, with just under 114,000 followers. I wanted to thank you for reading my article today, and hopefully, you’ve read many of my other articles on Seeking Alpha (just under 3,900).
All of us have winners and losers in the stock market, and it’s at times like these that we should reflect on the most important thing…
Reflect upon your present blessings, of which every man has plenty; not on your past misfortunes, of which all men have some.
Charles Dickens
Happy Thanksgiving!
Read the full article here


