Salesforce, Inc. (NYSE:CRM) is scheduled to release fiscal earnings for Q3 2024 on November 29, 2023. Salesforce anticipates a significant rise in its quarterly revenue, indicative of substantial growth from the previous year, despite facing challenges from fluctuations in foreign exchange rates. The forecast for earnings per share (EPS) also presents a positive picture, with GAAP and non-GAAP figures reflecting the company’s financial strength. This article delves into Salesforce’s financial status, examining its earnings outcomes and conducting a technical stock price analysis to identify future trends and investment prospects. Notably, the stock price demonstrates robust momentum ahead of Q3 2024 earnings, appearing poised to surpass critical thresholds.
Salesforce’s Earnings Outlook
The company expects a promising outlook, with anticipated growth across multiple areas, with revenue in the range of $8.70 to $8.72 billion, reflecting a year-over-year growth of approximately 11%. This growth is expected despite a $100 million impact from foreign exchange headwinds. The company is forecasting GAAP diluted EPS to be between $1.02 and $1.03 and non-GAAP diluted EPS to be slightly higher, between $2.05 and $2.06. Moreover, the company has raised its revenue guidance for 2024 to $34.7 to $34.8 billion, maintaining the same growth rate of approximately 11% year-over-year as the Q3 projections. The guidance for the operating margin and earnings is more robust for the full year, with the GAAP operating margin expected to be around 13.3% and the non-GAAP operating margin expected to be significantly higher at approximately 30.0%. The GAAP diluted EPS for 2024 is estimated to be between $3.50 and $3.52, while the non-GAAP diluted EPS is projected to double, at $8.04 to $8.06. Additionally, operating cash flow growth is expected to be strong, between 22% and 23%.
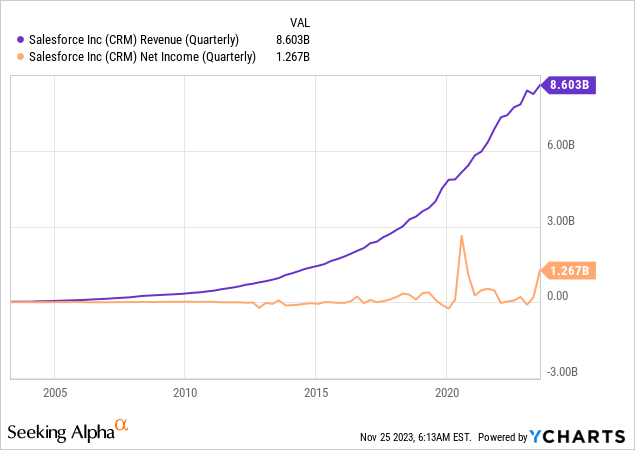
These strong earnings expectations for Q3 2024 come from the solid financial performance during Q2 2024. Under the leadership of Chair and CEO Marc Benioff, Salesforce has reported impressive results, showcasing the efficacy of its strategic initiatives and the growing demand for its AI-driven CRM solutions. The company’s revenue for the quarter stood at $8.603 billion, marking an 11% year-over-year increase. The year-over-year increase is consistent across subscription and support revenues, which rose by 12% to $8.01 billion, and professional services and other revenues, which saw a 3% increase to $0.60 billion. These figures underscore Salesforce’s expanding market presence and the continued adoption of its diverse service offerings. The chart below illustrates Salesforce’s quarterly revenue and net income, highlighting a pronounced parabolic increase in revenue generation. Concurrently, the net income displays a significant upward trend in the 2024 earnings results, indicative of robust profitability.

A key highlight for Q2 2024 was the record GAAP and non-GAAP operating margins reported by Salesforce. The GAAP operating margin reached 17.2%, while the non-GAAP margin was an impressive 31.6%. According to Amy Weaver, President and CFO of Salesforce, this achievement surpasses the company’s targets three quarters ahead of schedule, indicating efficient management and robust business operations. Despite restructuring costs, which negatively impacted the GAAP operating margin by 50 basis points, the company managed to exceed expectations in profitability.
Moreover, EPS reflects this strong performance, with GAAP diluted EPS at $1.28 and non-GAAP diluted EPS at $2.12. While losses from strategic investments and restructuring activities had a slight negative impact on EPS, the company’s overall financial health remains strong. The cash flow metrics further corroborate Salesforce’s solid financial position. The company generated $0.81 billion from operations, a staggering 142% increase year-over-year, and reported a free cash flow of $0.63 billion, up 379% year-over-year. These figures indicate a healthy cash-generating capability, essential for sustaining growth and investing in future initiatives.
Based on this impressive financial performance in Q2 2024, Salesforce is well-positioned to continue its upward trajectory in Q3 2024, with expectations of solid earnings. The company’s resilient revenue growth underpins this confidence despite challenges such as foreign exchange headwinds and its ability to maintain a robust growth rate year-over-year. The anticipated revenue increase, along with the forecasted GAAP and non-GAAP EPS for the full year, suggests that Salesforce’s strategic initiatives are yielding tangible results. This financial strength, particularly in the areas of operating margins and cash flow, enables the company to invest aggressively in innovation and market expansion, further cementing its leadership in the CRM industry and potentially leading to a more dominant market position and enhanced shareholder value.
Exploring Bullish Price Configurations
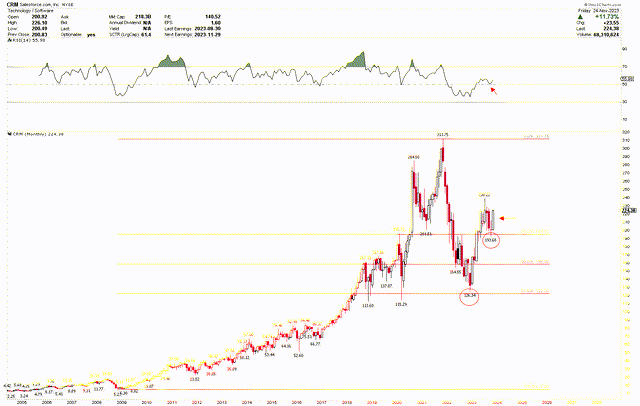
The monthly chart below illustrates the long-term prospects for Salesforce, which appear highly positive. A review of the stock’s performance reveals a steady upward trajectory from its 2008 low of $5.20. The company experienced its most impressive growth spurt following the 2020 dip to $115.29, soaring to a peak of $311.75. This remarkable rise in Salesforce’s stock value from its 2020 low is credited mainly to the rapid digital transformation across various sectors during the COVID-19 pandemic. As companies quickly transitioned to remote operations and digital customer interactions, Salesforce became pivotal in this shift. Its extensive range of applications, encompassing sales, service, marketing, and commerce, became essential for organizations striving to sustain operations and customer engagement in a digital-heavy environment.
Furthermore, Salesforce’s strategic acquisitions, notably its high-profile purchase of Slack, expanded its product range and solidified its role as a critical facilitator of digital business processes. This heightened demand for its services and enhanced capabilities significantly increased investor confidence, leading to a significant uptick in its stock price.

CRM Monthly Chart (StockCharts.com)
However, this notable ascent was accompanied by considerable volatility, with the stock retracing to robust support levels. Analyzing the Fibonacci retracement from the 2008 lows to the all-time highs, the 61.8% retracement level is positioned around $122.33. The pullback from the peak lows hit bottom at $126.34, close to this crucial support level, forming a robust base and sparking a strong upward movement. This rally has already surpassed the 38.2% Fibonacci level at $194.67 and is eyeing further gains. Recently, the stock corrected to the 38.2% retracement level of $193.68 in October 2023 but quickly rebounded in November 2023. The significant support marked by red circles in the chart and robust rallies signals a bullish, solid momentum moving forward. Moreover, the RSI being above the mid-level of 50 enhances the bullish outlook, with the October 2023 dip providing a buying opportunity as the RSI held at this mid-level.
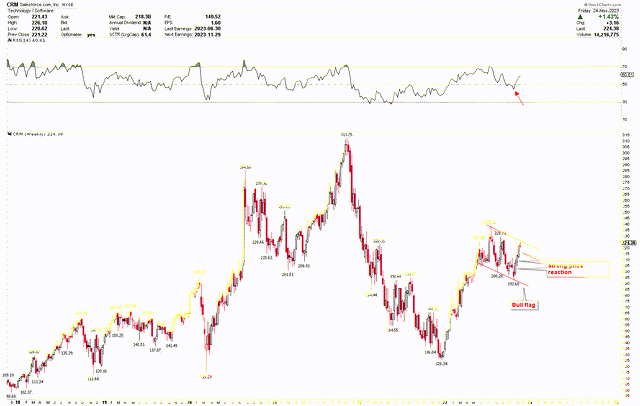
To gain a deeper insight into this bullish trend, the weekly chart below showcases a bull flag pattern outlined by red trendlines. The last three weeks’ candlesticks are robust, underscoring the strength in price. Additionally, the RSI is recovering from the mid-level, indicating further price momentum. The stock is currently positioned at the breakout point of this bull flag, just ahead of Q3 2024 earnings. The bullish indicators on both monthly and weekly charts suggest that the stock is poised to break out of this bull flag at $238.22, potentially triggering a robust upward surge.

CRM Weekly Chart (StockCharts.com)
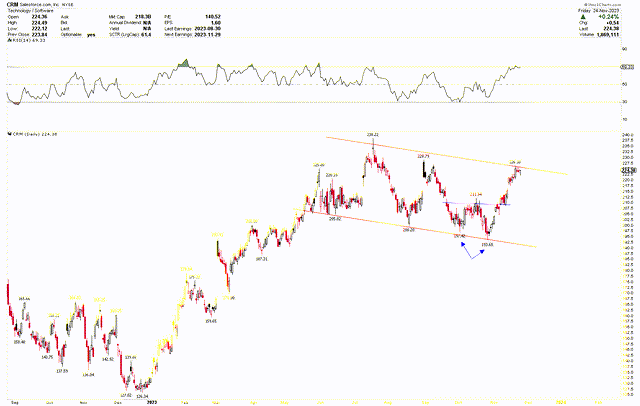
As seen in the daily chart, the short-term outlook echoes this bullish sentiment with a similar bull flag pattern. Notably, a double bottom formation at the red channel line at $197.42 and $193.68, followed by a break above $211.94, confirms this pattern. A subsequent break above $238.22 is likely to catalyze a significant rally.

CRM Daily Chart (StockCharts.com)
In anticipation of this upward surge, investors might consider purchasing the stock at current levels, targeting higher prices. The red circles marked on the monthly chart at $126.34 and $193.68 represent attractive investment opportunities.
Market Risks
Salesforce’s financial performance is subject to risks arising from broader economic fluctuations and foreign exchange headwinds. While the company has projected growth and solid financial outcomes, these forecasts are based on current, inherently uncertain economic conditions. Any adverse changes in the global economy, such as a slowdown in economic growth, inflation, or geopolitical tensions, could impact customer spending and, consequently, Salesforce’s revenue and profitability. Moreover, Salesforce’s international operations expose it to foreign exchange risks.
Moreover, Salesforce operates in a highly competitive market where rapid technological advancements are a constant feature. The company’s success in maintaining its market position and growth trajectory depends significantly on its ability to innovate and adapt to changing technology trends. Competitors, both established players and emerging startups, are constantly enhancing product offerings, often at lower prices. This competition could potentially impact Salesforce’s market share and pricing strategies. Moreover, as the company expands its AI-driven CRM solutions, it must continuously invest in research and development to stay ahead of technological advancements. Any failure to keep pace with these changes could adversely affect Salesforce’s attractiveness to customers and its financial performance.
While the technical analysis of Salesforce’s stock shows a bullish trend, the stock market is inherently volatile and influenced by various factors beyond the company’s performance. Investor sentiment, which can be swayed by broader market trends, regulatory changes, or shifts in technology sector dynamics, plays a significant role in stock price movements. The earnings release could experience volatility in the initial days, and a price drop below $192.68 would signal a continuation of downward momentum.
Bottom Line
In conclusion, Salesforce heads into Q3 2024 fiscal earnings release on a solid footing, bolstered by impressive growth forecasts and a resilient financial performance in the previous quarter. Despite challenges, the company’s robust revenue projections and optimistic EPS estimates reflect its financial strength and operational efficiency. Technical analysis of the stock price further supports a bullish outlook, with key indicators pointing towards a potential breakout and continued upward momentum. The formation of a bull flag, coupled with robust price movement following a double bottom, signals a potent upward trend. Additionally, the notably bullish November 2023 monthly candle, originating from the support level of $194.67, heightens the likelihood of an upward breakout from the bull flag following the earnings announcement. Investors may consider buying the stock at the current price and increasing holdings if a price correction occurs, provided the price remains above the $194.67 threshold.
Read the full article here


