Having previously covered US supermajor ExxonMobil (see here) as well as independent E&Ps Occidental Petroleum (see here) and ConocoPhillips (see here), I will move across the Atlantic in this note and begin my coverage of European Oil & Gas supermajors with French TotalEnergies (NYSE:TTE).
[Note: All company figures and financials are based on TotalEnergies’ official reporting and investor communication with financials in US$. All per share data refers to the NYSE listed US ADR]
Company Overview
TotalEnergies SE is a globally operating and vertically integrated energy company producing and marketing fossil and renewable fuels in more than 130 countries. With FY23 sales of $219B and a market cap of $156B it is currently the 4th largest of the Western supermajors, behind Exxon Mobil (XOM), Chevron (CVX) and Shell (SHEL) and ahead of BP (BP) and Eni (E). As a fully integrated oil major, the company operates across the entire energy value chain, ranging from upstream Oil & Gas exploration and production over petrochemicals to renewable power generation and biofuels.
Oil & Gas Production Split
Total has major footprints in the Middle East, West and North Africa, the North Sea and Brazil. It further has a small footprint in the US and Mexico, sharing working interest in currently 7 deepwater developments in the Gulf of Mexico after a portfolio streamlining. During 2023, Total also divested its Canadian operations in Surmont and Fort Hills oil sands, giving it a significantly lower weight in the Americas than the other European supermajors BP and Shell which both own sizeable NA portfolios (BP: Shale and GoM / Shell: GoM).
Key ongoing projects include Uganda and Suriname’s Block 58 as well as further ramp-up of Brazil production through 2 new FPSOs in the Santos Basin Mero field.
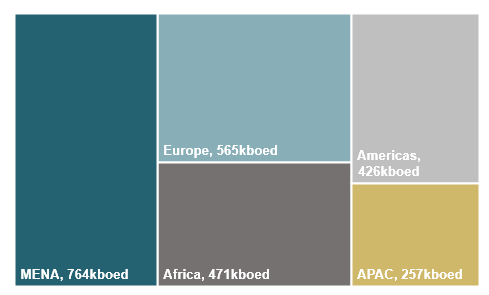
FY23 Hydrocarbon Production Split (Company Filings)
Key Investment Thesis
Deep, Liquids-Rich Portfolio in Cost-Advantaged Geographies
In 2023 Total produced ~2.48Mboed of hydrocarbons from fields across the globe, down 10% YoY on significantly lower gas volumes (-26%) with liquids up 2%. Adjusting for the company’s write-down of its 19.4% stake in Russian Novatek however, volumes were actually up 2% YoY from 2022’s ~2.44Mboed as its full exit of Canadian operations was offset by 4% volume growth contribution from start- and ramp-ups in Brazil, Norway and the Middle East.
Since 2018, total production has remained largely stable at an ~11% decline from 2.8Mboed to 2.5Mboed (flat excluding Novatek) versus significantly higher rates of decline at British peers Shell and BP (-24%/-37%) and similar rates at Eni (-11%). Looking ahead, Total’s management sees plenty of growth runway and aims to re-expand total hydrocarbon production by approximately 2-3% annually through the end of the decade while Shell only commits to stable production and BP anticipates further declines. Notably, Eni plans for the highest growth among EU majors at 3-4% annually through 2026.
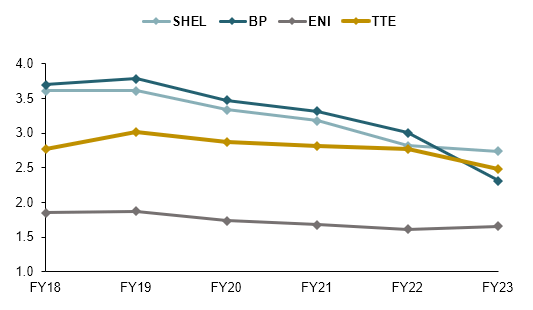
European Majors Production (kboed) (Company Filings)
In terms of proved reserves Total has also held up significantly better than other EU majors with YE23 reserves of ~11.2Bboe just 7% below YE18 levels at ~12.1Bboe while Shell and Eni’s reserves declined in the MDD and BP lost more than 64% of its reserves (o/w a large portion related to the exit of its Rosneft stake).
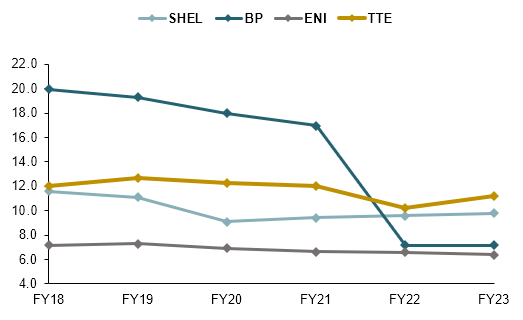
European Majors Reserve Life (Years) (Company Filings)
While production has declined by 11% over the period, Total has been highly successful in managing its inventory through peer-leading exploration efforts for a 113% average organic Reserve Replacement Ratio (“RRR”) since 2018, roughly 40pp above peer average at 71%. The organic RRR is a crucial figure for any company based on the exploitation of natural resources such as hydrocarbons as it indicates how much of annual production is readied through new discoveries (and revisions) with any figure below 100% showing a reserve depletion for the year.

European Majors Reserve Replacement Ratio (Company Filings)
Due to this best-in-class reserve management, Total currently holds the deepest portfolio among EU majors by a wide margin. With ~2.48Mboed of average daily production and ~11.2Bboe in proved reserves as of FY23, it can cover current production for more than 12.5 years, compared to EU peers at ~9.8 years.
Also considering US majors, Total’s R/P ratio screens only behind Exxon’s at 13+ years coverage based on its 2023 average daily production of 3.74Mboed and its current reserves of ~17.7Bboe with roughly 5Bboe of those reserves located in the Stabroek block off Guyana’s coast.
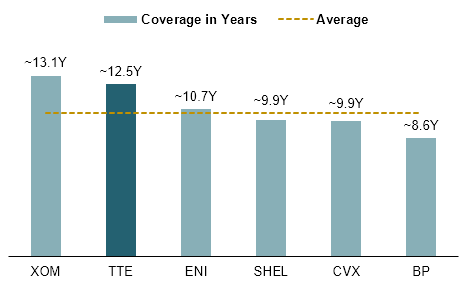
Global Supermajors Reserve Life (Company Filings)
As of 2023, the majority of Total’s current projects in exploration and development stage are located in cost-advantaged locations including onshore Iraq, where the company has vowed to invest $27B in an integrated gas and LNG project and Suriname where Total is currently exploring offshore fields adjacent to Exxon’s Stabroek block. Other projects include further ramp-up of production in Brazil’s Santos basin and a ~230kboed joint development in Uganda.
Comparing two of Total’s landmark projects which have recently been granted Final Investment Decision with peers’ projects, I see a significant cost advantage with the company’s Suriname’s Block 58 and Uganda developments coming at an estimated price point in the $40,000s/boe.

European Majors Landmark Projects (Company Filings)
Focusing on those low-cost developments while simultaneously divesting higher-cost operations including Canadian oil sands, Total has build-up a significant runway of highly cost-advantaged production with potential to supply hydrocarbons for the coming decades while decreasing costs further below peers. As of FY23, Total had approximate per barrel operating expenses of $5.1 along with DD&A of $4.8/boe, significantly below its peers.
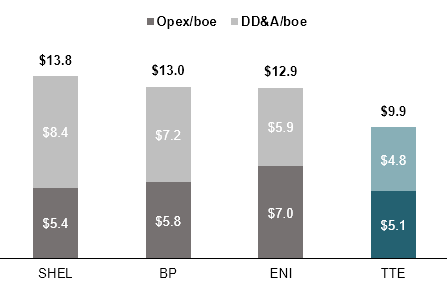
European Majors Expenses per Flowing Barrel (Company Filings)
With lower operating and depreciation expenses Total has been able to generate peer-leading profitability per flowing barrel, earning ~$9.3/boe in profits and ~$15.3/boe in EBIT respectively at roughly 26%/27% above peers.
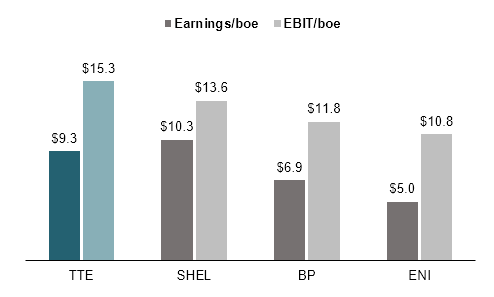
European Majors Earnings per Flowing Barrel (Company Filings)
Along with the deepest portfolio and highest profitability among its European peers, Total also has a production base that is significantly more weighted towards liquids as opposed to gas. For 2023, total hydrocarbon production was roughly 62% weighted towards liquids, up from 55% in 2022 largely due to Total’s Russia exit and the deconsolidation of Novatek’s gas-heavy production. At 62% liquids, Total’s output is well above EU peers which have on average a 50/50 liquids/gas split and second only to Exxon’s 67% share making for a highly attractive set-up in times of elevated crude prices relative to gas.
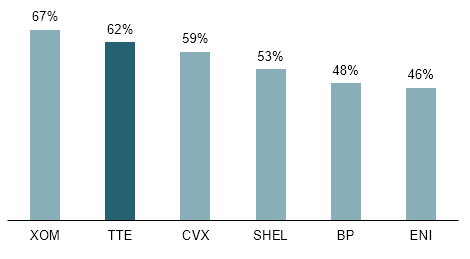
Global Supermajors Liquids Share of Production (Company Filings)
Best-In-Class Balance Sheet with Net Debt/CFO and Net Debt % of Assets roughly half of Peers
Looking at a full-cycle time frame from 2018 to today, Total has consistently led the group in terms of balance sheet strength, standing below its peers in both leverage (Net Debt/CFO) and gearing (Net Debt as % of Total Assets).
After a spike in leverage to 2.8x in the midst of the Covid-Era in 2020, Total has consistently been the lowest levered of the European majors coming out of the pandemic at 1x in 2021, and 0.4x in 2022 and 2023. Notably, Total further improved its balance sheet during 2023 with a drop in CFO compensated by $3B debt repayments while several peers saw both declining CFOs and a re-uptick in debt levels for an average 0.9x leverage (i.e. ENI net debt growing ~$4.5B over FY23).
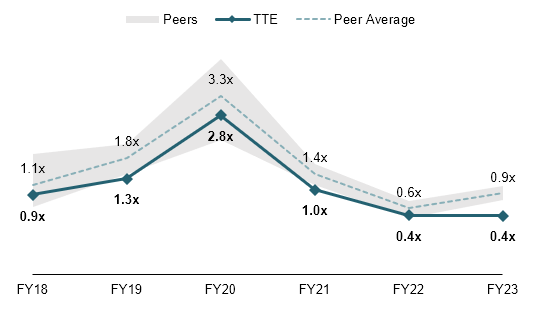
Net Debt / CFO (Company Filings)
I see a similar pattern in net gearing where after an initial spike at 16% in 2020, Total has consistently improved its ratio to currently 6%, significantly below group average of 11%. Even as total assets declined across the group, Total continued the track record of delevering over the past year while peers’ gearing ticked up again.
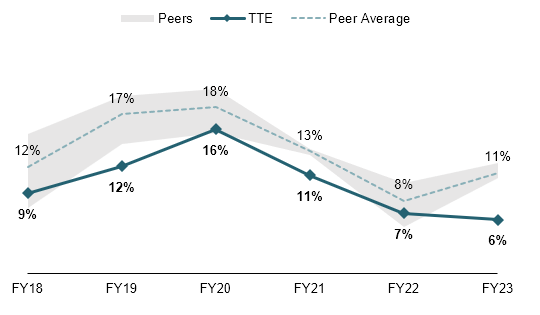
Net Debt as % of Assets (Company Filings)
Targeted asset sales and divestments have been a key factor in enabling Total’s recent balance sheet strength. In 2023 alone the company exited 3 major businesses: its 50% stake in Canadian oil sands development Surmont, its remaining Canada assets and its retail fuel station network across Germany and the Netherlands. In total those divestments brought in ~$8.4B which the company used to both pay down debt and fund further shareholder distributions.

Company Filings
Backed by its fortress balance sheet, I see a significantly greater capital allocation optionality versus peers. As of current Total only has limited operations in the US upstream sector with assets in the GoM and Texas Barnett Shale. Despite already having the deepest portfolio among peers, given its significant firepower available to fund M&A or JVs, I see some flexibility for the company to broaden its US operations, partaking in the current shale consolidation. Assuming a reasonable firepower of ~$25B, I estimate several potential targets which could allow Total to further diversify operations and improve per barrel metrics. Although I do not view this as very realistic given European stance on further oil & gas exploration activities and the company’s wider strategy to become a more integrated energy & power company, it does undeniably add some additional strategic flexibility which should be valued accordingly.
Peer-Leading Returns on Capital and to Shareholders
Next to sporting the cleanest and most resilient balance sheet among its peer group, Total also leads in capital efficiency and returns to shareholders. Accounting for the 3 years from 2020 to 2023, the group had an average ROCE (Net Income / Assets less Liabilities-ex-Debt and Minorities) of 11.9%, above Shell at 11.3%, BP at 10.2% and ENI at 5.4%. Compared to peer average, Total was able to realize a ~22% higher capital efficiency on the basis of both its pristine balance sheet management and higher per barrel profitability.
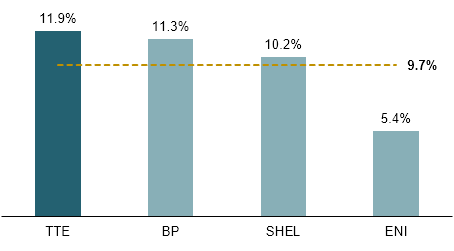
European Majors L3Y ROCE (Company Filings)
Along with returns on total capital, the company also exceeded peers in Returns on Equity (Net Income / Common Equity) at 17% versus peer average at 14.3%.
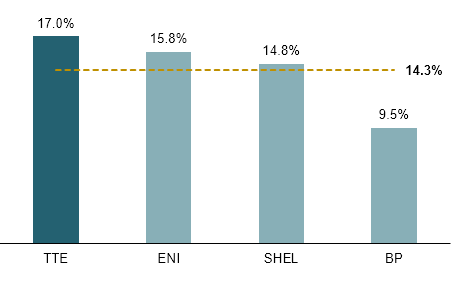
European Majors L3Y ROE (Company Filings)
Delivering superior returns relative to its balance sheet, Total further had the highest returns to shareholders relative to CFO generated over the period. With ~36.8% of CFO distributed via dividends and buybacks, the company scores ahead of BP at 35.5% and Shell at 34.6% with ENI well behind at 29.1% for a group average of ~34%.
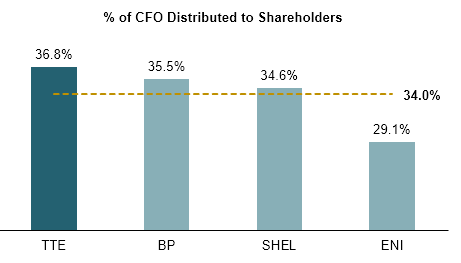
European Majors L3Y Share of CFO Returned to Shareholders (Company Filings)
Going forward, management announced a fixed lower cap of 40% of CFO to be distributed back to shareholders with FY23 returned capital at ~44%. This framework is one of the best among EU majors with Shell and ENI targeting 30-40% and 25-30% of CFO respectively. BP aims to pay out 80% of surplus cash flows (post-dividend-FCF) which can, based on Capex needs, exceed 40% of CFO, however given higher volatility in Capex I prefer a more resilient allocation based on CFO.
Based on announced and consensus FY24 dividends and consensus CFO/Surplus CF used in line with company guidance (for Total I assumed $8B in buybacks as announced by management), I estimate Total to offer ~10.5% in forward shareholder yield, ahead of Shell and ENI and just behind BP at ~12.7%.
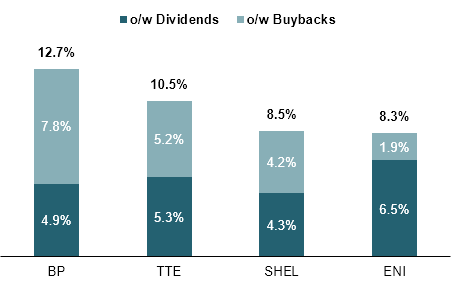
European Majors 2024e Shareholder Yield (Company Filings and Author’s Estimates)
Valuation
For my valuation of Total I will derive my price target as a 50/50 blend of 2 methods: a multiple valuation based on forward P/E relative to returns on equity and a fundamental valuation based on a 10Y DCF.
Multiple Valuation
Despite having the deepest portfolio and highest capital efficiency among its peers, I find Total trading at a significant discount to its British supermajor peers at 7.2x forward EPS with BP and Shell currently at 8.3x and 7.5x respectively and more in line with Italian ENI which demonstrates far weaker fundamentals.
Assuming a trading multiple in line with last 3Y achieved return on equity, I estimate a fair P/E of ~9.0x for a price target of $81 per US share and a current upside of ~26%.
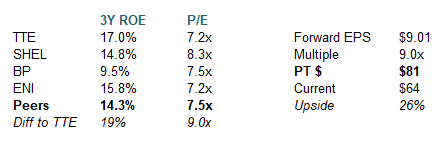
TTE P/E Valuation (S&P Market Intelligence, Author’s Estimates)
DCF Valuation
For my DCF I will largely follow official investor communication delivered by Total management during its September 2023 Capital Markets Day focusing on mid-term strategy and outlook as well as FY24 guidance as presented during the recent FY23 earnings call.
Through 2028, management estimates it will be able to grow CFFO by ~$6B versus the $35.9B achieved in FY23 for a total FY28 CFFO of ~$42B. 50% or ~$3B of this increase is to be contributed by growth in Oil & Gas Upstream with several projects coming online in the period including key Uganda and Suriname developments. Past FY28 I estimate a sustainable growth rate of ~2% per year with oil & gas likely more stagnant against higher growth integrated power for FY23-33 CAGR of ~3%.
For Capex I estimate ~$17.5B per year from FY24-28 at the upper end of $16-18B guidance, after which I assume a slight decrease in Capex to $17B as major O&G projects will have achieved first oil by then. Across the cycle, management will keep ~$2B in Capex for flexibility in lower price environments, however I do not assume those in my base case.
Adding up CFFO and Capex I see a total FCF CAGR of ~6% through FY33, reaching $28B by the end of the period. Assuming an exit multiple at 5x on FCF, below my estimate of 6x for XOM based on Total’s higher drift towards near-term FCF dilutive renewables Capex, I calculate a total equity value of $246B or $103 per share implying ~55% upside.

TTE DCF (Company Filings and Author’s Estimates)
Price Target
Considering both methodologies and assuming an equal 50/50 split between them I calculate a blended price target of $92 per TotalEnergies US share, giving ~44% upside to trading levels as of March 1. Key risks to my thesis include worse than expected oil & gas fundamentals and cost overruns on major projects in Uganda and Suriname along with political and regulatory changes including but not limited to windfall taxes and political instability in production countries.
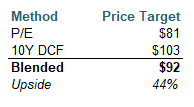
Company Filings and Author’s Estimates
Read the full article here


