Written by Nick Ackerman, co-produced by Stanford Chemist
The last time we covered the Liberty All-Star Growth Fund (NYSE:ASG), we were making a comparison with its sister fund, Liberty All-Star Equity Fund (USA). ASG’s distinction is it is more “growth” oriented, as its name would suggest. USA, on the other hand, has a portfolio that has a slightly higher tilt toward value.
These closed-end funds have managed distribution plans, with ASG paying out 8% of net asset value per year and USA’s portfolio having a slightly higher 10% distribution policy. Of course, the underlying investments they are holding don’t provide sufficient dividend payments to cover these payouts.
Instead, like most equity closed-end funds, they will require capital gains and sometimes return of capital will also show up—thus, why these payouts are called “distributions” and not “dividends.” Still, these higher relative distributions can be beneficial to the income-investor folks who want a more passive stream and enjoy having the portfolios managed for them.
ASG Basics
- 1-Year Z-score: 0.02
- Discount/Premium: -7.35%
- Distribution Yield: 8.28%
- Expense Ratio: 1.13%
- Leverage: N/A
- Managed Assets: $344.158 million
- Structure: Perpetual
ASG’s investment objective is to “seek long-term capital appreciation.” To achieve this, the fund will invest primarily in equity positions. In an attempt to achieve the objective, they utilize a multi-managed strategy. ALPS Advisors selects these managers to manage each sleeve of the portfolio. They are split between “small-cap growth,” “mid-cap growth,” and “large-cap growth.”
Currently, these are the assigned managers.
ASG Portfolio Managers (ALPS Advisors)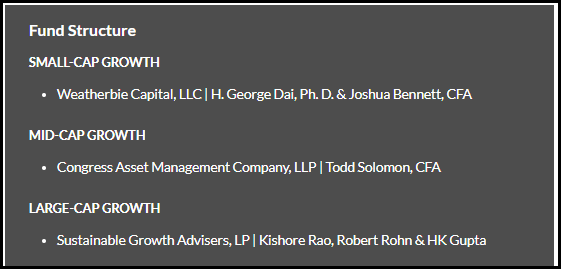
However, a recent press release shows that the Board is looking to assign Westfield Capital Management Company to the large-cap growth bucket and replace Sustainable Growth Advisers. That will be up for shareholder approval in this year’s annual meeting.
USA Basics
- 1-Year Z-score: -0.12
- Discount/Premium: -2.25%
- Distribution Yield: 10.59%
- Expense Ratio: 0.93%
- Leverage: N/A
- Managed Assets: $1.939 billion
- Structure: Perpetual
USA’s investment objective is to “seek total investment return, comprised of long-term capital appreciation and current income. It seeks its investment objective through investment primarily in a diversified portfolio of equity securities.”
USA similarly takes the approach of investing its portfolio through different buckets and assigning different managers. They split into only two buckets, though, between value and growth. The value sleeve gets three managers, and the growth gets two different managers. This leads to how we get a slight tilt toward a value-oriented fund.
USA Value Managers (ALPS Advisors)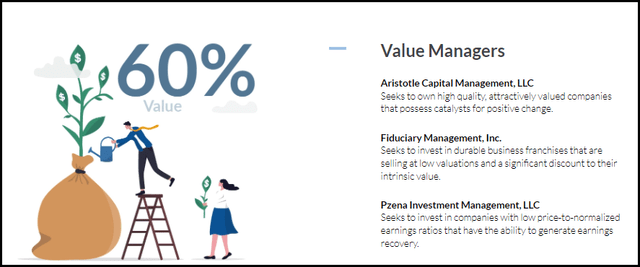
Though at 60%, that still leaves a significant allocation dedicated to growth.
USA Growth Managers (ALPS Adivors)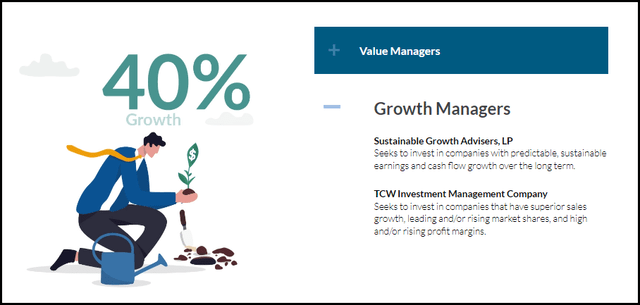
USA is also significantly larger, and that helps to contribute to a smaller overall total expense ratio. It also provides more liquidity with a higher average daily trading volume. ASG daily average volume comes to 202,270, with USA at 641,333. Given that USA is also trading at a higher share price, that works out to around $4.4 million daily volume compared to ASG’s around $1.07 million, for some better context.
Performance – Discounts Opening Up Make More Attractive Potential Opportunities
The majority of closed-end funds are leveraged. However, neither of these two funds is leveraged, and that can be beneficial for investors who are relatively more conservative. As conservative as a broader general equity fund can be, that is.
The performance between ASG and USA since our last update had USA leading the way by a wide margin.
Ycharts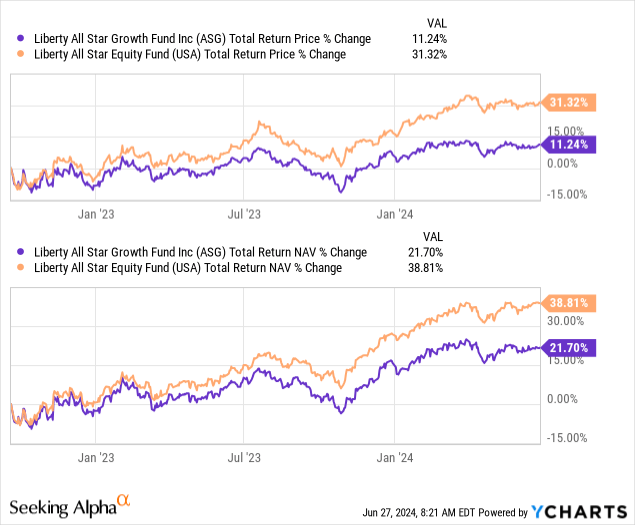
Of course, that’s a rather arbitrary date for comparison as it goes back to September 19, 2022.
Looking over the last year, we can see that USA was able to lead the way. Though, both funds fell short of the SPDR S&P 500 ETF (SPY) for some context.
Ycharts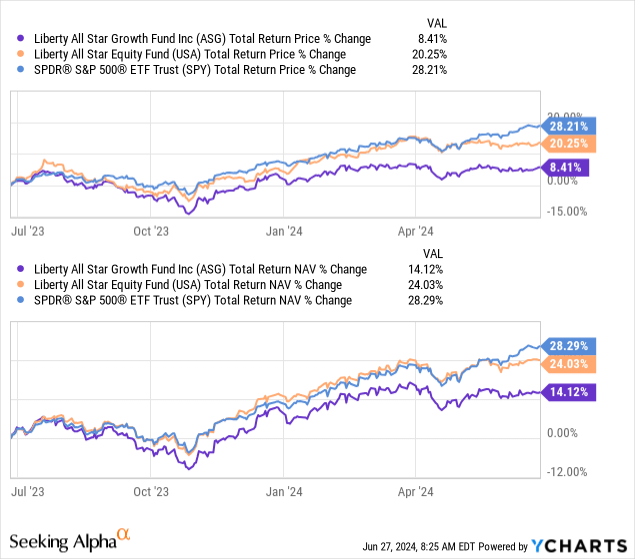
Over the last five years, we have a bit more of an interesting chart. At one point, coming out of the COVID pandemic market crash, it was ASG that was leading the way. However, that quickly faltered into 2022, where the fund fell further relative to USA and SPY. Over this period, SPY really outperformed on both a total share price and NAV return basis.
Ycharts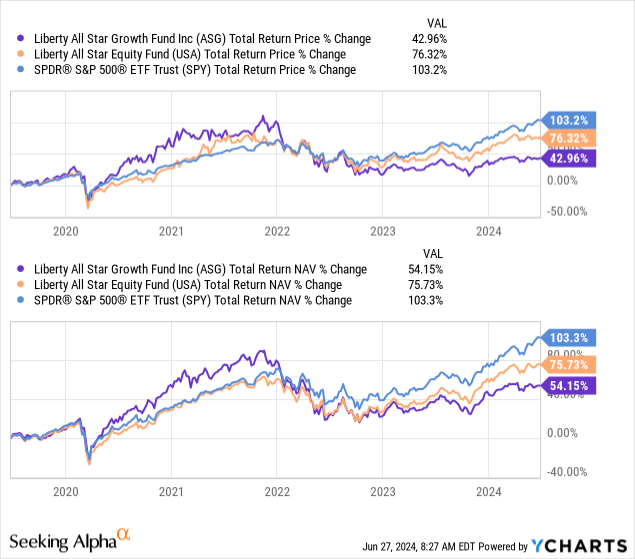
Finally, over the last decade, USA and ASG actually performed nearly identically on a total NAV return basis. SPY once again came out on top by a meaningful margin.
Ycharts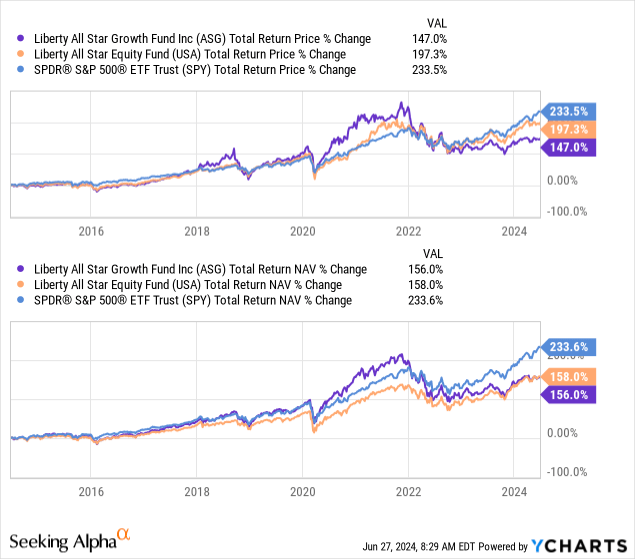
USA had a better performance based on a total share price return, though.
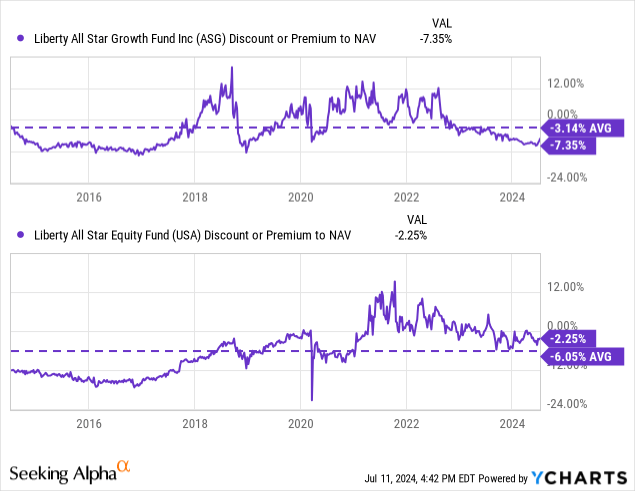
That comes from the fact that, like all CEFs, they can trade wildly based on discounts/premiums, which can add more risks but also an opportunity to exploit some of these swings. When we last covered both of these funds, they were at premiums, and now both are presenting discounts. ASG, in particular, is looking like a better bet on the valuation front on an absolute and relative basis.
This is because ASG has tended to command a narrower average discount compared to the USA. Based on this, USA is actually looking a bit more on the expensive side as, over the last several years, the fund had been flirting with trading at a premium.
Managed Distribution Policies
While the funds had underperformed SPY by large margins historically, they do provide a more enticing distribution, which most income-investors will be more focused on in the end.
For ASG, they pay out an 8% distribution policy annually based on paying 2% each quarter.
ASG Distribution History (CEFConnect)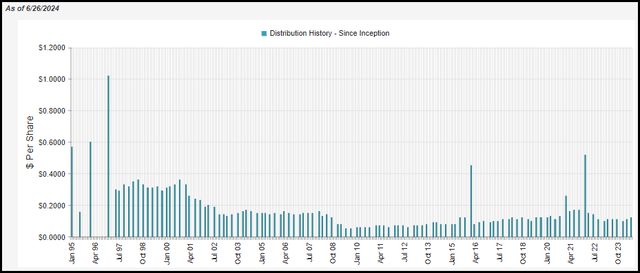
USA has a slightly higher distribution policy at 10% or 2.5% paid out each quarter.
USA Distribution History (CEFConnect)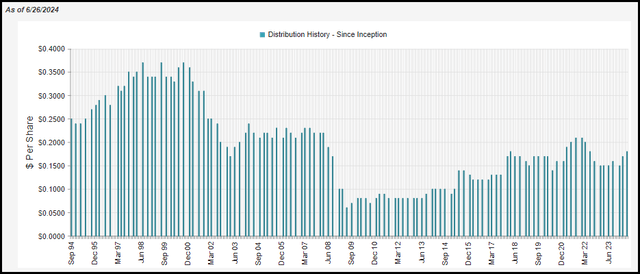
As NAV per share moves around, so too will the quarterly distributions as we can see. In strong years, we’ll see the payouts continue to rise and vice versa.
ASG didn’t show return of capital in its distribution as it had long-term capital gains in previous years they could harvest. That appears to have changed for 2023, as we see ROC distributions show up in the tax classification.
ASG Distribution Tax Information (ALPS Advisors)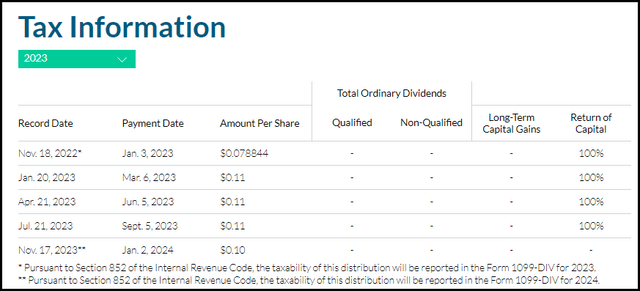
USA was different in that it was showing ROC classifications in its distribution in the prior two years, but it hadn’t for 2023.
USA Distribution Tax Information (ALPS Advisors)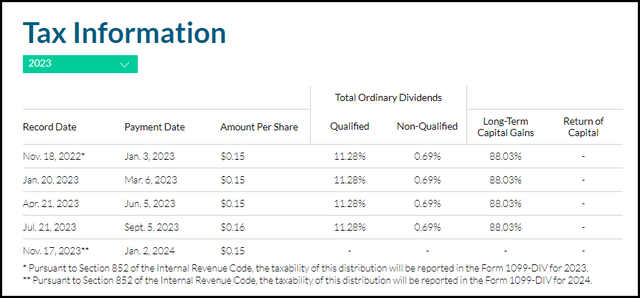
Watching the tax classifications isn’t all that helpful, though because it could be rather misleading.
There are reasons why funds can show ROC distributions, like the case with ASG, where the fund actually saw its NAV rise throughout 2023 but still had ROC classified for tax purposes.
What we are seeing is that the fund simply didn’t harvest those gains that the fund saw, leaving them as unrealized. Instead, they realized losses and had negative net investment income. Therefore, for tax purposes, it resulted in 100% ROC classifications. Here is the last annual report breakdown for changes in net assets for ASG:
ASG Annual Report (ALPS Advisors)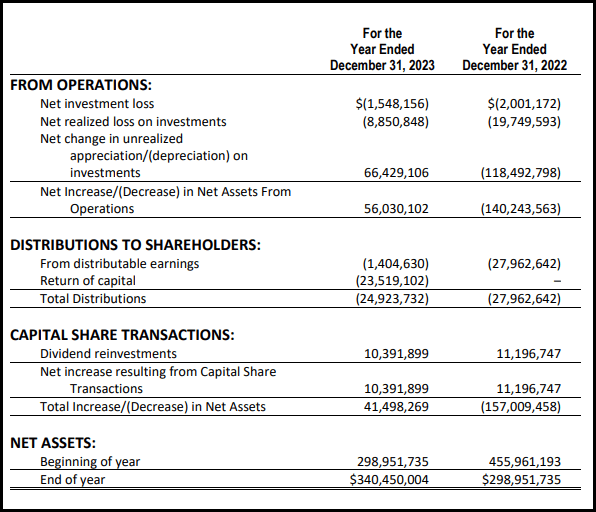
Unsurprisingly, with USA, we saw massive realized gains (and unrealized gains, for what it’s worth.) Along with the fund’s net investment income, those sources were enough to cover their distribution to investors—translating into why we didn’t see ROC for 2023 for USA. Here’s their breakdown from their last annual report:
USA Annual Report (ALPS Advisors)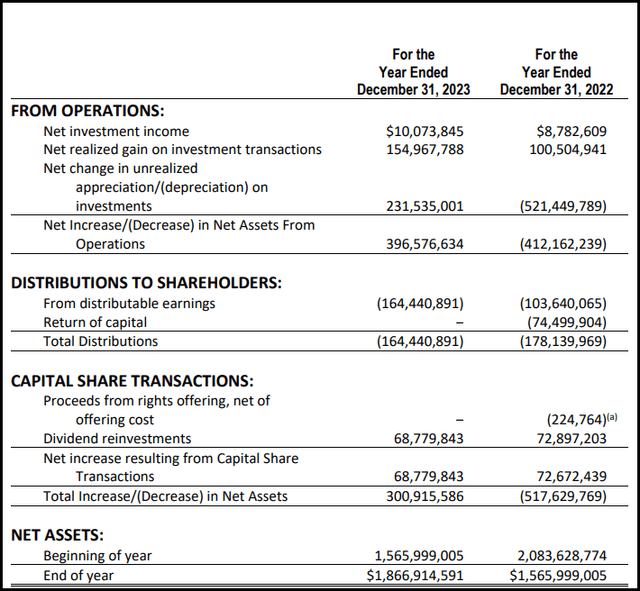
To sum up, it’s simply all about watching NAV, and that’s really the case for all equity funds. If NAV is trending higher or flat, the distribution is being covered. More importantly for ASG and USA, it’s also determining the direction of what they are actually paying out quarterly.
A Look At The Portfolios
Initially, I would have expected ASG to carry a larger allocation to tech by a meaningful margin. However, that isn’t really the case, as the allocations of tech aren’t all that different. ASG isn’t even carrying tech in as high of an allocation that SPY is these days, as SPY is at around 30%.
ASG/USA Sector Breakdown Allocation (ALPS Advisors)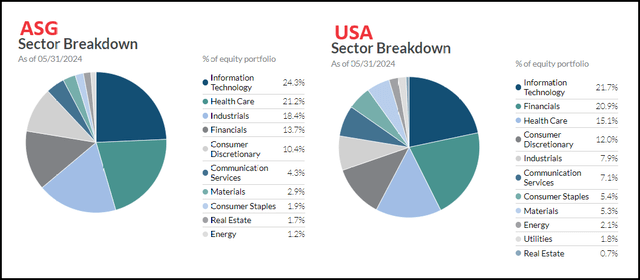
We can see some slight differences throughout the portfolio, such as healthcare being the second largest weighting for ASG, whereas USA’s second largest allocation is to financials. Financials are ASG’s fourth largest allocation behind industrials, which I would not have expected seeing industrials as a higher allocation for that fund compared to USA.
On the flip side, the sectors with the least exposure are similar. The funds both carry rather negligible allocations to energy, real estate and utilities. Utilities don’t even show up as a sector allocation for ASG.
In looking at the top ten holdings, we see some overlap with the mega-cap tech names. That includes Amazon (AMZN) and Microsoft (MSFT). However, ASG has really underweight allocations as those are the only two of the Super Six that make an appearance. They aren’t even the largest allocations.
ASG Top Ten Holdings (ALPS Advisors)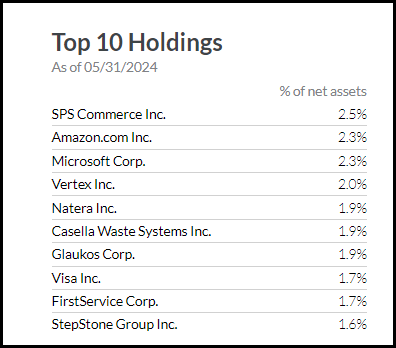
That’s a major difference between USA where that fund also has NVIDIA (NVDA) and Alphabet (GOOG). Those two names, along with AMZN and MSFT, show up as the largest four holdings for the USA, which Meta Platforms (META) also makes an appearance. The only Super Six name missing would be Apple (AAPL). Both funds also carry a position in Visa (V) in the top ten.
USA Top Ten Holdings (ALPS Advisors)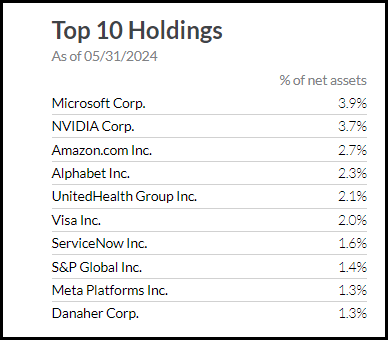
For ASG, we also see the fund’s small and mid-cap sleeve exposure being represented as well. The fund’s largest holding, SPS Commerce (SPSC), is a mid-cap name with a market cap of around $6.8 billion. Casella Waste Systems (CWST) carries a market cap of $5.72 billion, Glaukos Corp (GKOS) is similar at $5.87 billion, as is FirstService Corp (FSV) at $6.73 billion and StepStone Group LP (STEP) at $5.11 billion.
For both of these funds, seeing underweight to the mega-cap tech names overall is going to be the major factor in explaining the underperformance relative to SPY. For ASG, that is even more apparent as we see the fund’s relatively smaller cap leaning. Of course, the higher relative expense ratios are also playing a role.
Conclusion
ASG and USA provide pretty straightforward equity exposure with managed distributions. They take a similar approach with different managers selected for the different sleeves of their portfolios. The funds have sector allocations that aren’t that wildly different; however, when taking a deeper look, the portfolios have only some rather limited overlap.
The discount/premiums can also be exploited by investors willing to make more active moves. ASG has sunk to an attractive discount while USA is trading above its historical level still. That could make ASG the better choice today, but the fund has also been experiencing weaker performance too. Given the differences between the funds, though, it would mean that making a direct comparison wouldn’t necessarily be the most appropriate. Both could be held and still provide reasonable enough differences to complement each other.
The lower total returns for both funds aren’t great when compared to SPY, but the other argument that could be made is that they are more diversified. ASG, more specifically, is diversified up and down the market cap spectrum, which has been to its detriment over the last couple of years. However, that was its greatest attribute during the 2021/2022 bull market run when more speculative growth names were racing higher.
Further, income-oriented investors are probably going to be more focused on their managed distribution policies. Each fund has a managed distribution policy to pay out a meaningfully higher distribution to investors quarterly. This creates a passive stream of payouts for those investors that they don’t have to manage themselves.
Read the full article here


