Introduction
At the request of my exclusive subscriber to compare Johnson Controls International (NYSE:JCI) and Honeywell International (HON), I decided to prepare a detailed comparison article.
However, upon further scrutiny of the companies’ operations, it became evident that while both HON and JCI provide offerings in the realms of HVAC systems, building automation, controls, and energy efficiency, they differ significantly in their areas of focus and product portfolios. As a result, they are classified under separate industries. Consequently, I have decided to write two separate articles: one comparing JCI to its closest competitor and another examining HON in comparison to its closest peer.
Today I compare JCI with one of its closest peers in terms of operations – Carrier Global Corporation (NYSE:CARR) to pick the most likely outperformer. So let’s get started.
JCI vs. CARR: Business Models And Key Financials
Johnson Controls International is a $44-billion market cap firm that’s primarily engaged in the manufacturing of HVAC systems (heating, ventilation, and air conditioning), building management systems, and automotive batteries. JCI organizes its operations into 4 businesses: Building Solutions NA (33% of 2Q sales), Building Solutions EMEA/LA (15%), Building Solutions Asia Pacific (9%), and Global Products (37%).
Carrier Global [$40 billion market cap] provides a wide range of heating, ventilating, and air conditioning systems for residential, commercial, and industrial applications. The company has 3 business segments: HVAC (68% of 1Q revenue), Refrigeration (17%), and Fire & Security (16%).
So it’s obvious that both Johnson Controls International and Carrier Global have a strong presence in the HVAC and building technologies sector, and their product offerings and target markets overlap to a significant extent. Also, both companies are similar in terms of size and the amount of revenue generated and EBITDA, as shown in the following table:
| Operation metrics | JCI | CARR |
| Market cap [$B] | 44.59 | 40.11 |
| Revenue [$B, TTM] | 26.09 | 21.04 |
| Gross profit [$B, TTM] | 8.827 | 5.549 |
| EBITDA [$B, TTM] | 2.564 | 3.836 |
| Net income [$B, TTM] | 1.391 | 2.528 |
| CFO [$B, TTM] | 1.684 | 2.065 |
| CAPEX to Sales [TTM] | 2.20% | 1.70% |
| Total employees [FY] | 102,000 | 52,000 |
Source: Author’s work, based on YCharts and Seeking Alpha Premium data
I see that JCI has a higher gross profit margin, but the company’s EBITDA and profit margins lag behind CARR – JCI has 2x SG&A expenses compared to CARR, possibly due to the larger headcount from the table above.
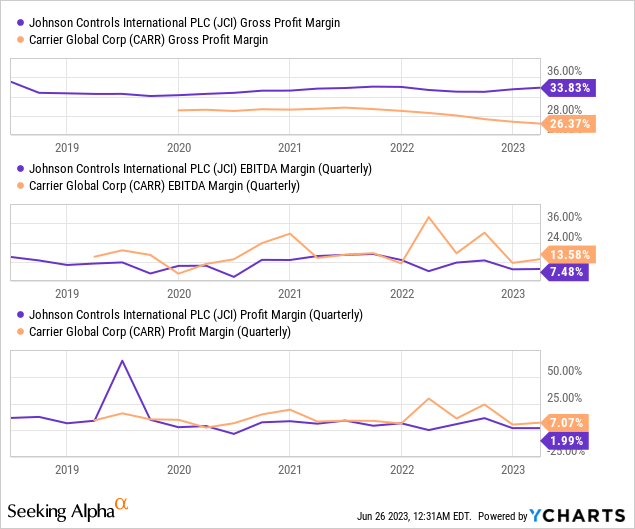
However, not everything is so obvious here: Since the IPO of CARR, the company’s EBITDA margin, although still higher than JCI’s, has been on a clear downward trend, unlike JCI’s:
Seeking Alpha Charting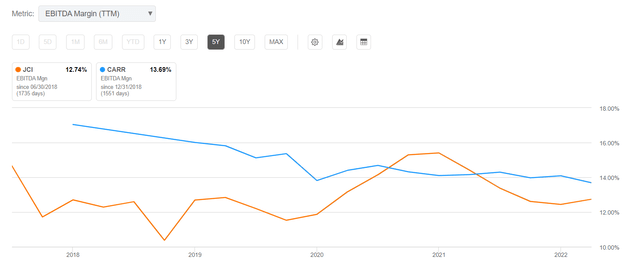
Why is this so? Let us first take a look at the financial dynamics of the two companies’ business units:
| JCI | CARR |
Additionally, JCI’s sales backlog stood at $11.7 billion, representing a 9% increase compared to the previous year. On the top line, they anticipate organic sales to grow approximately 10% for the full year. |
|
Source: Author’s work, based on 10-Qs and Argus Research data
JCI appears to have more potential for revenue and net income growth over the next couple of years as it keeps recovering from supply chain issues from 2022.
Goldman Sachs’ analyst, Joe Ritchie, seems to agree with that assessment [June 1, 2023 – proprietary source], predicting JCI’s EPS to grow around 18% in FY23 and mid-teens in FY24, supported by strong orders and backlog, which have shown an acceleration in the 2nd quarter. The expansion is going to be aided by investments in digital offerings and higher service attachment rates, leading to increased market share. This shift towards services is anticipated to be margin accretive, as service margins are higher than installation margins. Cost-saving initiatives are also expected to contribute to higher incremental margins.
Ritchie’s views differ from the consensus, particularly in highlighting the multi-year topline tailwinds from Education stimulus:
Goldman Sachs [June 1, 2023 – proprietary source], author’s notes![Goldman Sach [June 1, 2023 - proprietary source]](https://startingbusinesseasy.com/wp-content/uploads/2023/06/49513514-16877612866064272.png)
As for CARR, the firm continues to refine its portfolio of businesses – that’s the main priority today as far as I can see. CARR plans to acquire Viessman Climate Solutions, a European-based company, for $13.8 billion. This acquisition aims to drive strong growth in Europe, with expectations of over 100 basis points of revenue growth and accretive impact on adjusted EPS within 2 years. The transaction is set to close by year-end and it seems to me to be quite an expensive acquisition given the revenue impact CARR will get in return. Simultaneously, the company plans to divest its Fire & Security and Commercial Refrigeration businesses, with the divestiture expected to occur in FY2024, according to Argus Equity Research [proprietary source].
From what I see at the moment, I draw the following conclusion so far: although JCI has relatively lower margins, they are expanding, unlike CARR’s ones. Also, JCI’s future growth should be well above that of CARR, whose corporate strategy looks somewhat different at the moment. It remains to be seen how much the two companies’ valuations differ to draw a definitive conclusion.
JCI vs. CARR: Valuation Changes All?
JCI’s forwarding price-to-earnings [non-GAAP] ratio is ~24x, 23.5% higher than that of CARR. On the other hand, JCI’s PEG ratio, which takes into account the future growth rate, is 41% lower – a pretty big discrepancy in my opinion. EV/Sales and EV/EBITDA forwarding ratios are about the same:
Seeking Alpha Premium, author’s notes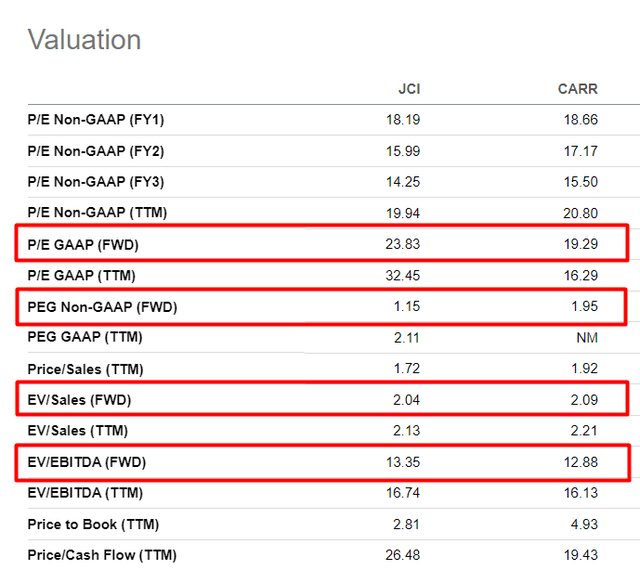
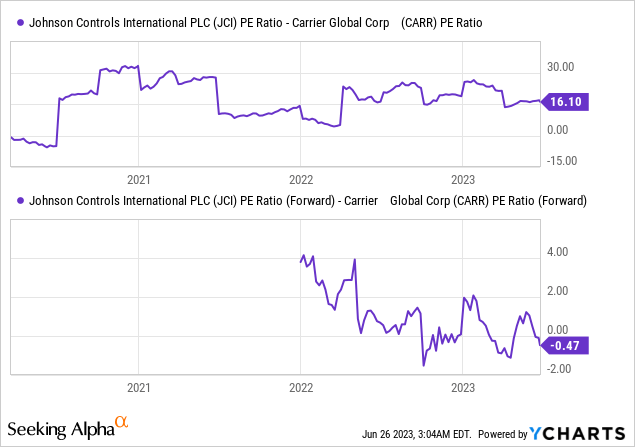
We see a rather interesting picture: the two companies should theoretically have a relatively stable relationship between their multiples [a field for analysis of pair traders]. Based on TTM ratios, both companies trade relatively fairly to each other (close to the average historical spread). But everything changes when you look at FWD metrics – JCI is getting cheaper relative to CARR, which is not the historical normal:
At the same time, JCI returns more capital to its shareholders through a combination of buybacks and dividends:
| JCI | CARR |
| The CEO: “Year-to-date, we have returned over $700 million in capital, including roughly $250 million in share repurchases and nearly $500 million in cash dividends.” | Repurchased $62 million during Q1 and paid out $154 million in dividends [=$216 million in total]. |
Source: Author’s compilation
Considering that analysts believe JCI should grow its EPS CAGR at about the same level as CARR over the next 5 years (but much faster over the next 3 years), the implied P/E ratios suggest that JCI’s relative undervaluation at 2023 will persist in all subsequent years, with the largest discrepancy in 2025:
| EPS YoY-growth rates | JCI | CARR |
| 2023 | 19.07% | 10.02% |
| 2024 | 13.77% | 8.73% |
| 2025 | 12.23% | 10.76% |
| 2026 | 10.29% | 17.88% |
| 2027 | 7.95% | 7.80% |
| Median: | 12.23% | 10.02% |
| CAGR [2023-27] | 8.75% | 8.92% |
| implied P/Es | JCI | CARR |
| 2023 | 18.19 | 18.66 |
| 2024 | 15.99 | 17.17 |
| 2025 | 14.25 | 15.50 |
| 2026 | 12.92 | 13.15 |
| 2027 | 11.97 | 12.20 |
| Median: | 14.25 | 15.50 |
| CAGR of P/E contraction [2023-27] | -8.03% | -8.15% |
Source: Author’s work, Seeking Alpha Premium data
Perhaps the market is right in its assessment of what is happening. However, it seems to me that JCI is the more sensible choice in the current situation because CARR’s focus on Europe and the acquisition of Viessman Climate Solutions as part of this plan should significantly expand its customer base, but at the same time drain the company’s balance sheet in terms of cash. Looking at how weak the European economy is right now, I see certain risks in the timing of this expansion of the company in the old world.
Bloomberg data
Final Thoughts
From the comparison I did in today’s article, I can conclude that JCI appears to be somewhat better positioned than CARR based on forwarding growth metrics and valuations. Of course, CARR has higher margins today. But in the dynamics of the last few quarters, the difference between the two companies is shrinking rapidly. Given the new acquisition of CARR and the planned divestiture of the Fire & Security segment, market uncertainty should increase, but it has not yet. JCI should be worth more, in my opinion, given the margin expansion planned – again, this is not yet the case (anyway, looking ahead to FY2024 valuations and beyond). Maybe something has slipped my mind – let me know in the comments. In the meantime, I rate CARR a strong “Hold” and JCI as a “Buy” with a 12-month price target of $77 – in line with Goldman Sachs analysts, who base that forecast on an estimated EBITDA of 13.0x. That’s an upside of ~18.5% to the latest closing price.
Thanks for reading!
Read the full article here


