Nvidia Corporation (NASDAQ:NVDA) stock is up more than 1,200% in the last five years and 238% year-to-date (YTD). However, even after beating fiscal Q3 2024 earnings estimates and issuing guidance that also surpassed expectations, the future cash flow expectations baked into the current stock price are disconnected from reality. We think they are much too high for any reasonable investor to believe Nvidia can achieve them. The bottom line is that the fundamentals of the business have not improved at anywhere close to the pace of the meteoric stock rise.
The artificial intelligence (AI) hype that is driving the company’s stock is similar to the crypto and blockchain hype that drove other stocks to nosebleed heights, only to fall back down to earth a few months after the hype wore off.
Below, we’ll use our reverse discounted cash flow (“DCF”) model to illustrate the expectations baked into Nvidia’s current stock price and quantify just how risky the current valuation is.
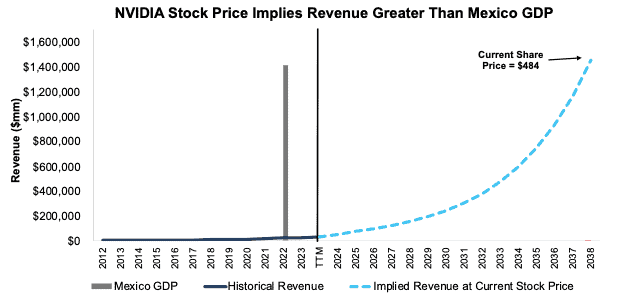
Stock Price Implies Nvidia’s Revenue Will Be Larger Than Mexico’s GDP
To justify its current price of $484/share, our model shows that Nvidia would have to:
- immediately improve NOPAT margin to 38% (highest ever – achieved in fiscal 2022),
- grow revenue by consensus in fiscal 2024 (101%) and 2025 (47%), and
- grow revenue 25% each year thereafter through fiscal 2038.
In this scenario, Nvidia’s revenue would grow 30% compounded annually for 15 years and reach $1.45 trillion in fiscal 2038. This revenue level would be 32x TTM ended fiscal 3Q24 and higher than the 2022 GDP of countries such as Mexico, Turkey, Switzerland, and Ireland. Figure 1 illustrates the magnitude of the implied revenue growth in NVIDIA’s stock price.
Figure 1: Implied Revenue Growth in Nvidia’s Current Stock Price Vs. Sovereign Countries’ GDP
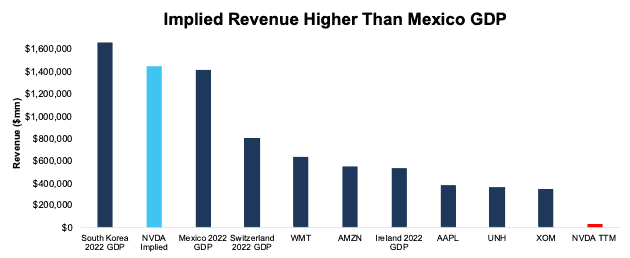
For reference, this implied revenue would be 2.3x Walmart Inc.’s (WMT) TTM revenue, which generates the most revenue in the S&P 500 Index (SP500) and 1.2x the combined TTM revenue of Walmart and Amazon.com, Inc. (AMZN). Furthermore, $1.45 trillion in revenue would be the 14th highest 2022 GDP in the world, right between South Korea and Mexico. See Figure 2.
Figure 2: Implied Revenue in NVDA vs. Country GDP and Highest Revenue Generating Firms
Stock Price Implies Ridiculous Profits, Too
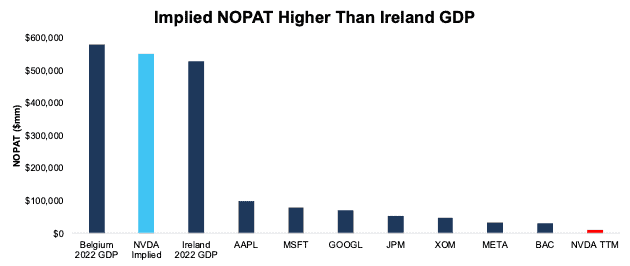
While revenue vs. GDP is the more apt comparison, we also compare the implied net operating profit after-tax (NOPAT) in this scenario to 2022 GDP levels. The scenario above implies Nvidia’s NOPAT grows 33% compounded annually through fiscal 2038 to $549.5 billion, or 49x its TTM ended fiscal 2Q24 NOPAT.
For reference, this implied NOPAT would be 5.4x Apple Inc.’s (AAPL) TTM NOPAT, which is the highest NOPAT in the S&P 500 and 1.6x the combined TTM NOPAT of Apple, Microsoft Corporation (MSFT), Alphabet Inc. (GOOG, GOOGL), JPMorgan Chase & Co. (JPM), and Exxon Mobil Corporation (XOM) (the companies with the highest TTM NOPAT in the S&P 500).
Furthermore, $549.5 billion in profit would make Nvidia the 25th largest GDP in 2022, right between Belgium and Ireland. See Figure 3. ROIC in this scenario would also equal 68%, up from 50% in the TTM.
Figure 3: Implied NOPAT In NVDA vs. Country GDP and Highest NOPAT Generating Firms
There’s 40%+ Downside Even with Massive Growth
Given the optimism baked into the stock price, we also quantify the downside risk should Nvidia not achieve the lofty expectations detailed above.
Instead, if we assume Nvidia:
- maintains NOPAT margin at 35% (equal to TTM) and
- grows revenue by consensus in fiscal 2024 and 2025, and
- grows revenue by 20% each year thereafter through fiscal 2038, then
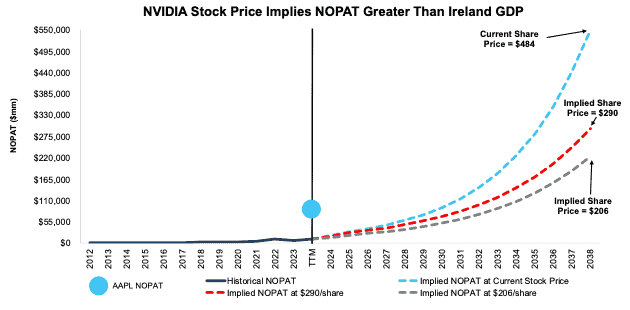
the stock would be worth just $290/share today – a 40% downside to the current price.
In this scenario, Nvidia revenue would grow 26% compounded annually for 15 years and reach $855.1 billion in fiscal 2038. This implied revenue would be 1.4x Walmart’s TTM revenue and 73% the combined TTM revenue of Walmart and Amazon.
This scenario also implies Nvidia’s NOPAT grows 28% compounded annually through fiscal 2038 to $296 billion. This implied NOPAT would be 3.0x Apple’s TTM NOPAT and 85% the combined TTM NOPAT of Apple, Microsoft, Alphabet, JPMorgan, and Exxon Mobil. This scenario also implies Nvidia improves its ROIC to 62% in fiscal 2038, up from 50% in the TTM.
There’s 57%+ Downside if Margins Fall to Apple Levels
Lastly, if we assume Nvidia:
- NOPAT margin falls to 26.1% (equal to Apple’s TTM Margin, and above Nvidia’s 10-year average of 24.9%) through 2038,
- grows revenue by consensus in fiscal 2024 and 2025, and
- grows revenue by 20% each year thereafter through fiscal 2038, then
the stock would be worth just $206/share today – a 57% downside to the current price. This scenario still implies that Nvidia generates $223 billion in NOPAT in 2038, which is 2.2x Apple’s TTM NOPAT and 90% of Apple, Microsoft, and Google’s combined TTM NOPAT.
Figure 4 compares Nvidia’s implied future NOPAT in these scenarios to its historical NOPAT. For reference, we include the TTM NOPAT of Apple, which has the highest NOPAT in the S&P 500.
Figure 4: Nvidia’s Historical and Implied NOPAT: DCF Valuation Scenarios
The above scenarios assume Nvidia grows revenue, NOPAT, and free cash flow (“FCF”) while change in invested capital averages 11-13% of revenue throughout each DCF scenario. For reference, Nvidia’s change in invested capital has averaged 20% of revenue over the past five years, 12% of revenue over the past decade, and 9% of revenue over the past 15 years. As a result, our conservative capital growth assumptions make the above scenarios even more optimistic than if the future capital growth rates are closer to historical rates. Most likely, the capital growth rates will be much, much higher to support the unusually high revenue growth rates that the stock prices implies the company will achieve for so long.
This article was originally published on November 22, 2023.
Disclosure: David Trainer, Kyle Guske II, Italo Mendonça, and Hakan Salt receive no compensation to write about any specific stock, sector, style, or theme.
Read the full article here


