By Brian Luke
Long-time investors in products linked to the S&P GSCI remain keenly aware of the outsized role oil has in broad commodity performance. Reviewing the projected weights of the 2024 S&P GSCI rebalance oil is expected to remain the largest commodity in the index. WTI and Brent crude oil are projected to swap positions and collectively account for over 40% of the S&P GSCI. World production averages of crude oil are predicted to fall 1.2% in 2024, reflecting a gradual decline in production averages from the time period used by S&P Dow Jones Indices.1
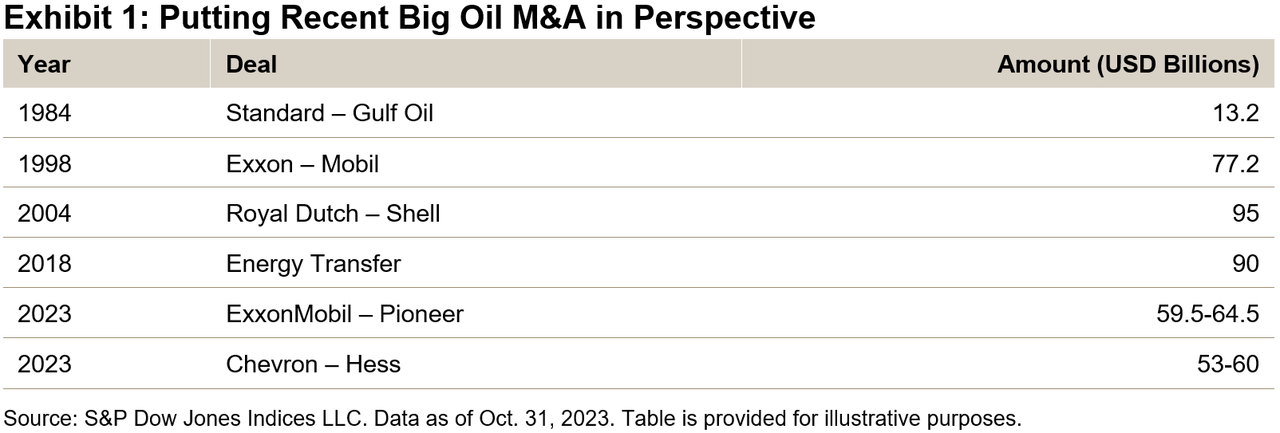
Big oil dominated the headlines in October after strong YTD performance in 2023. The S&P GSCI Crude Oil finished the third quarter up over 18%, outperforming stocks, bonds and broad commodities. This led to not one, but two blockbuster deals in October. Exxon Mobil (XOM) struck first, paying USD 59.5 billion for Pioneer Natural Resources (PXD), the largest acreage holder in the shale rich Permian basin. Chevron (CVX) then ponied up to buy Hess Corp. (HES) for USD 53 billion to gain access to the largest recent offshore oil discovery near the South American country of Guyana. These deal values, if closed, would be roughly double the famous KKR buyout of RJR Nabisco in 1989 and would rank within the top 10 in the 2020s.

Oil, along with other risk assets, slumped throughout the month, dropping 10%. Poor petroleum performance pushed the S&P GSCI down 4%, holding onto a 2.75% YTD gain. Industrial metals and livestock also fell in October, while natural gas gained 13% and gold rose 7% among the risk-off sentiment.
Energy transition is a significant topic among market participants. The S&P GSCI employs a production and weighted approach to measuring broad commodity performance. The decades-long decline of energy relative to other sectors has indeed taken place in the S&P GSCI. However, the recent M&A activity, as well as the S&P GSCI rebalance, indicates oil’s value to investors and importance to the market is not going away quickly.
1 The 2024 S&P GSCI Rebalance takes world production averages from 2016 to 2020.
Disclosure: Copyright © 2023 S&P Dow Jones Indices LLC, a division of S&P Global. All rights reserved. This material is reproduced with the prior written consent of S&P DJI. For more information on S&P DJI, please visit S&P Dow Jones Indices. For full terms of use and disclosures please visit www.spdji.com/terms-of-use.
Original Post
Editor’s Note: The summary bullets for this article were chosen by Seeking Alpha editors.
Read the full article here


