The iShares 20+ Year Treasury Bond ETF (NASDAQ:TLT) has ripped higher recently as the market has priced in Fed rate cuts. That big move higher has a trader betting that TLT will give back some of its recent gains, falling below $94 by the middle of January, which would mean that long-term interest rates move higher.
The move up in the TLT started following the quarterly refunding announcement from the US Treasury back on November 1. That refunding announcement was better than feared, as investors were betting on the Treasury issuing more longer-term debt. However, the Treasury decided not to issue more longer-term debt, and that sent investors betting on higher rates scrambling to cover their short positions, pushing rates down and TLT up.
Then, the TLT took another leg higher last week, following the FOMC December meeting, with a dot plot that showed the Fed pricing in 3 rate cuts in 2024. This sent rates across the curve sharply lower and thus pushed the TLT higher.
However, since the FOMC meeting, Fed officials have come out in force to push back against the market pricing for as many as six rates in 2024, essentially saying that the market is now pricing into many rate cuts. Following a big move down in rates, it seems possible there could be a retracement in rates higher, which could push the TLT lower, primarily if the economic data doesn’t support as many rate cuts as the market is pricing in.
This could be prompting a trader to bet on the TLT falling, with a significant open interest position increase for the January 19, 2024, $94 puts and calls. The calls saw their open interest levels increase by 71,631 on December 18, while the puts saw their open interest increase by 127,929 contracts.
The data shows many of these puts were bought for about $0.35 per contract. At the same time, many of these calls were sold for about $6.00 per contract. This seems to be a bet that the TLT will fall below $94 by the expiration date, allowing the trader to keep the premium earned by selling the calls and profit if the ETF falls below $94.
Trade Alert Trade Alert

It could also be a hedge against a long position in the TLT. Regardless, it indicates that whoever created the trade is fearful that the TLT will move lower from here.
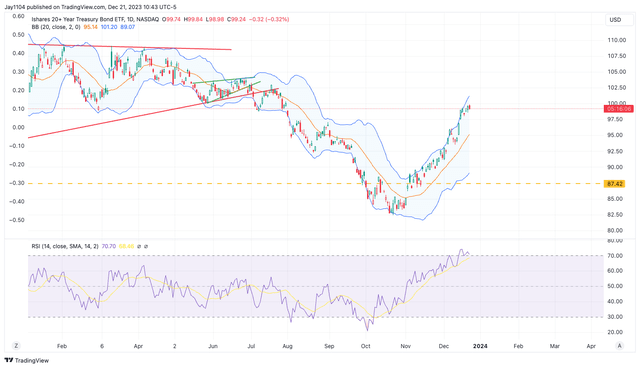
Certainly, the TLT has reached overbought levels, as noted by the increase in the TLT above the upper Bollinger band and the RSI climbing above 70. This doesn’t mean that the TLT has to move lower, but it does suggest that the TLT’s recent rally pauses and potentially consolidates some.
TradingView
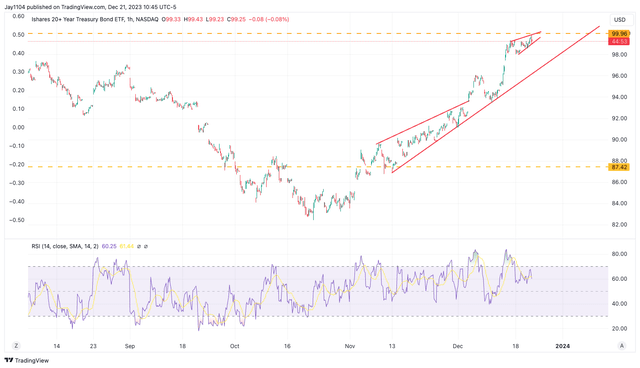
The TLT has filled a gap that dates back to August and now has several gaps at lower levels that need to be filled, down to about $94.60. Additionally, the TLT now appears to be forming a rising wedge and an ending diagonal triangle, suggesting a move lower in the TLT.
TradingView
The move up in the TLT has been strong. While the trend is higher, the ETF is, at the very least, overbought, suggesting a consolidation period. However, it seems reasonable enough for an options trader to bet on a pullback, especially if the Fed continues pushing back on 2024 rate cuts, and the economic data remains strong.
Read the full article here


