Thesis
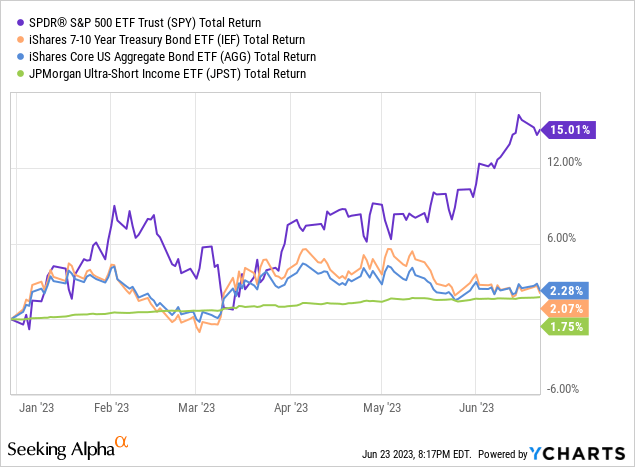
The S&P 500 ETF Trust (NYSEARCA:SPY) experienced a spectacular rally due primarily to the AI starting mania and BIG 8 price and earnings growth. The earnings projections of the remaining 490 corporations did not improve. Despite the fact that the S&P has grown by more than 15% this year, I believe it is more prudent to invest in short-term securities than in the S&P due to its expensive valuation, increased downside risks, and increased FOMC dot plot projection. Put and call volumes also indicate a short-term reversal. On the other hand, as demonstrated by my research below, 10Y treasuries have room to grow based on core inflation model, even if we estimate a decline in core inflation, which is extremely difficult to achieve without an increase in the unemployment rate and with wage pressures continuing to rise. Even though almost all leading indicators for inflation are declining. Nevertheless, based on my arguments, long-term bonds will provide greater protection than the S&P 500 at current prices over the medium term. The most effective approach is to look for attractive pricing in the money market funds, such as JPMorgan Ultra-Short Income ETF (NYSEARCA:JPST), park the cash there, and avoid the current bond and stock markets. However, from the long-term investing approach, it´s different.
Macro call, implied fed funds rates and inflation expectations
Initially, I’d like to make some introduction calls based on the current market pricing. We must calculate and examine market-based derivatives to determine the consensus among market participants. We will look at Fed Funds Futures in order to examine the market-priced rates for the end of 2023, 2024, and 2025, as well as their spread, to determine how much the market believes the Fed will end up cutting. In addition, based on such pricing, we will examine long-term inflation expectations by calculating the spread between nominal long-term yields and the yield on Treasury inflation-indexed securities, where we will have a clear picture of inflation expectations. When this approach is completed, we will be able to make some statistical and fundamental assumptions about inflation, based on leading indicators and my own thoughts. This step-by-step approach could give us confidence in the thesis and the reasons why we view it in this way, despite the fact that I am vulnerable to be wrong.
Implied rates priced in by market participants
In summary, market participants anticipate (via futures) that rates will be close to 5.3% in December 2023 and 3.8% in December 2024. Still significantly below the Fed’s most recent dot plot, in which the FOMC desires the rate to be 5.6% in 2023 and 4.6% in 2024.
Implied FFR and priced rate cuts. (Author´s calculation.)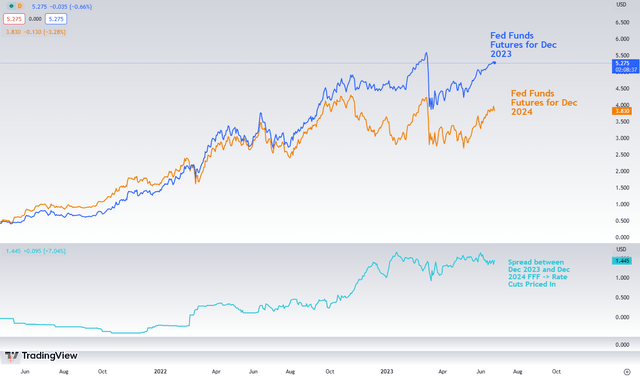
Participants anticipate the rate cuts (spread between Fed Funds Futures for Dec 2023 and Fed Funds Futures for Dec 2024) to be astoundingly 1.45% based on current market pricing. FOMC in their protection expects rate cuts as well, amounting to 1.0% from their projected FFR for 2023, but the market sees it very differently, betting that inflation will fall much faster or Fed will not keep its word about long-term higher rates and likely pricing in more financial stability threats, stemming from continuing global monetary tightening. Below is the dot-plot from the most recent forecast, which was released in June. The market doesn’t even consider the lower bound set by Fed participants in Central Tendency for interest rates, which is 5.4% in 2023 and 4.4% in 2024. The central tendency excludes the highest and lowest three annual projections for each variable. It is eliminating the largest doves and hawks.
FOMC June projection (FRED)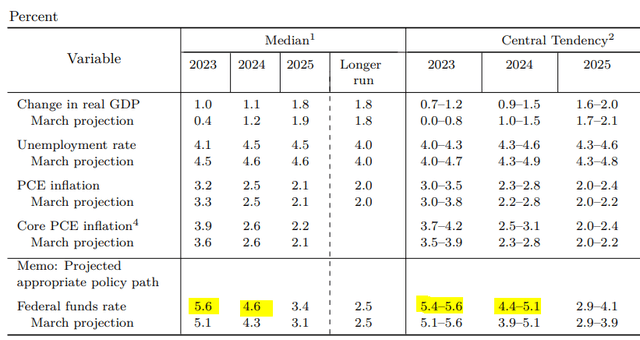
If the market were just to revert rates to the lower boundary, it would result in greater valuation pressure for stocks (higher WACC due to higher rates, higher risk premia, and lower estimated FCF calculations), as well as increased pressure on margins due to higher interest expenses, particularly in highly rate-sensitive industries (high CAPEX, large portion of debt, and leveraged companies) and through higher yields on short- and medium-term rates. However, the most recent point is highly debatable, as each additional rate hike could result in an even greater yield curve inversion due to the increased likelihood of policy error or economic growth destruction.
If you would like to examine the global picture of additional rate cuts (priced in), based on globally significant central banks (21/6/2023), here is an excellent illustration. The US has the most aggressive easing priced in.
Fed seen to be out-doving G10 (Twitter, TS Lombard, Bloomberg)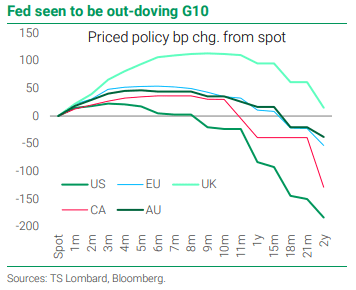
Inflation expectations – differences between Fed and market pricing
In addition, it is beneficial to consider what the market says about inflation. We can begin with expectations for short- to medium-term inflation. We are unable to examine the short-term market-based inflation break-even rates due to a lack of real time data. The FOMC closely monitors these inputs, which are measured by the US Michigan 1Y Inflation Expectation and the Cleveland Fed Model (1-year inflation expectations). In spite of the fact that the US Michigan model is based on a survey and is rapidly falling, participants anticipate a one-year inflation rate of 3.3% (down sharply from 4.2% a month ago). On the other hand, the Cleveland model is always updated after the most recent inflation print (in June) and dropped sharply, suggesting that 1-year inflation expectations will decline to 1.3%. I have also calculated the spread between monitored assumptions, which is nearly 2%, which is quite significant and above the five-year average.
Short-term inflation expectations. (Author´s calculation. Tradingview)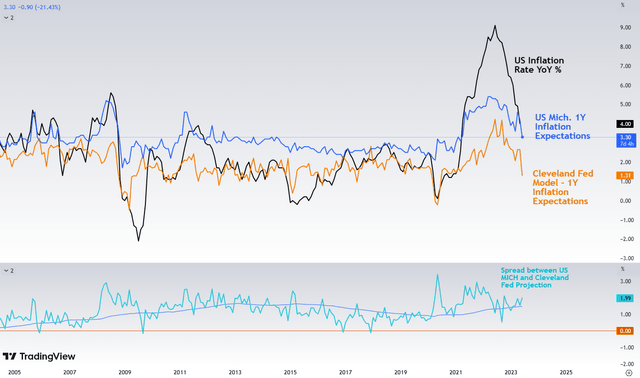
From my perspective, it falls somewhere within this range. I am convinced that the inflation rate will continue to decline, but the Cleveland model is, in my opinion, extremely optimistic. However, it is essential to remember that both measures are forward-looking, and CPI is lagging.
As we stated in the previous chapter, and as indicated by the pricing of interest rates, the market is pricing an inflation success with a high degree of certainty, which is also reflected by the US inflation breakeven rate (annualized average inflation) and is significantly increasing over longer time periods.
Market are priced for Fed Inflation success (Twitter. TS Lombard, Bloomberg.)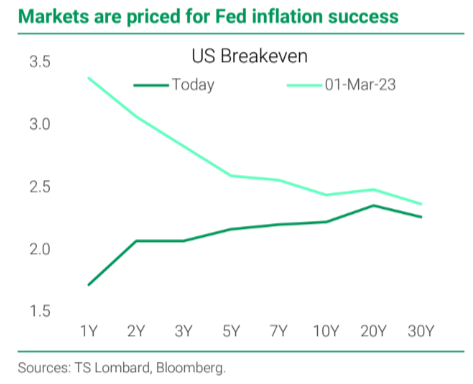
It suggests that market participants see success in the short-term battle for the average inflation rate in 1Y and 2Y, but medium- and long-term inflation expectations are on the rise, so inflation expectations are becoming increasingly anchored above the Fed’s primary target of 2%. They intend to reduce it to such a level as a centralized target. This is another reason why, in my opinion, Fed will challenge market conditions and we could see rates reprising. Due to the present level of interest rates, as mentioned previously, market-based inflation expectations remain substantially above the inflation-targeting rate. It could result in lower future stock returns and higher yields on intermediate- and long-term bonds. Finally, there are three ways to examine the medium-to-long-term inflation expectations in 5 years. As stated previously, the US Michigan survey-based model predicts that the 5-year average inflation rate will reach record highs of 3.1%. This is extremely negative for the Fed, as inflation expectations are being firmly anchored above the target rate. If there is no decline, the next dot plot projection for short-term FFR (2024, 2025) is unlikely to show a sharp decline.
Medium-term inflation expectations. (Author´s calculation. Tradingview.)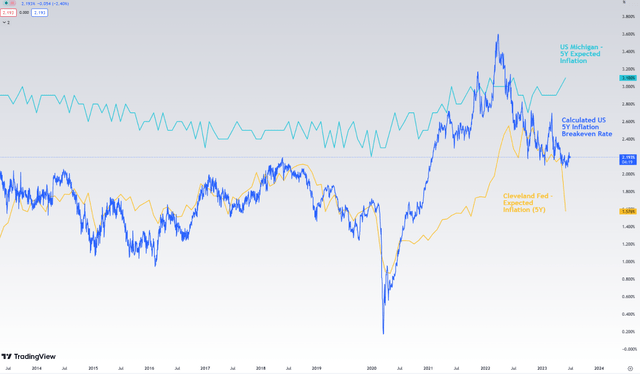
However, there is also a significant market-based approach, which can be monitored via breakeven rates. We calculated it as the difference between the 5Y US government yield and the 5Y TIPS yield. The spread is the breakeven rate (five-year average annualized inflation). However, the breakeven rate is just above the Fed’s target rate, at approximately 2.2%. While it is also affected by the value of crude oil, it remains significantly above its long-term average, indicating that the Fed is not yet finished. From my perspective, it can decline significantly if:
- Oil prices continue to deteriorate significantly (providing a deflationary impulse to prices),
- or inflation prints fall below analysts’ expectations (there are still upwards drivers, such as strong wage growth and a robust labor market),
- or the Fed maintains its stance and the market needs to reconsider its rate expectations.
The next model is based on Cleveland estimates, which, in my opinion, grossly underestimate the potential outcome and have dropped to 1.57 percent. However, I have not analysed this outcome, so this is merely my initial impression.
Inflation
While headline CPI and some leading indicators, such as M2 and PPI, as well as the food index, oil, ISM price paid and many others are trending downward, core inflation is somewhat sticky. This is due to the fact that inflation in services and goods is still present, and that this decline is primarily the result of falling transportation and food costs.
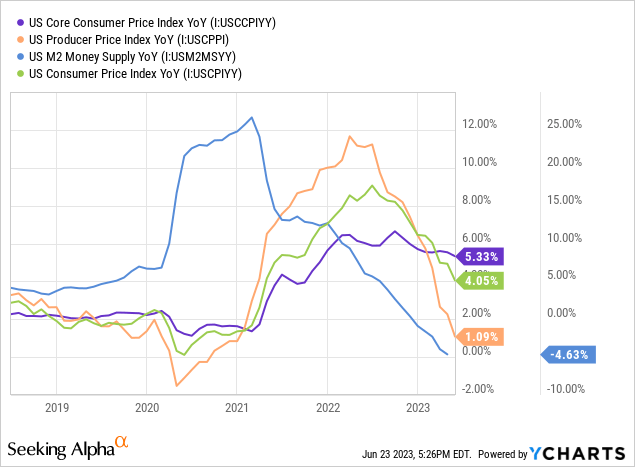
To examine the outcome, however, I would like to point out that the current inflation print is significantly more affected by the base effect, which, in my opinion, is the primary reason why inflation is declining and deleveraging in prices is not making as much progress, despite achievement being made. It is evident when we examine the most significant contributors listed below. Due to its base effect, the transport item is now a negative contributor.
US Inflation Breakdown (Gurufocus)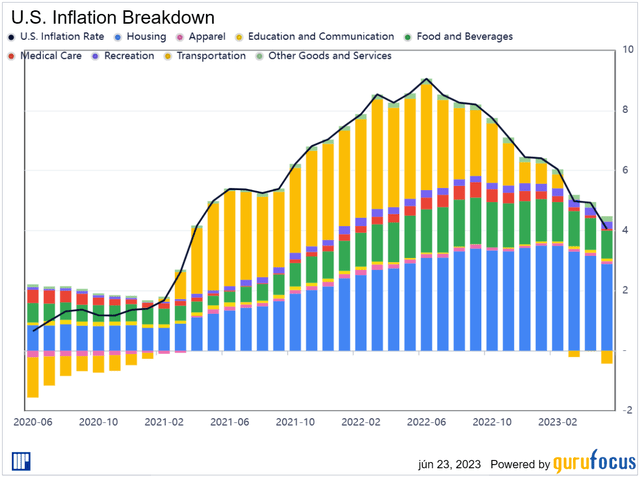
Considering the monthly contributors and modifications, we cannot assert that there is no progress. In the case of housing, the most essential component, we observe an uptick despite a decelerating trend, as is the case with apparel, medical care, and other categories. However, looking ahead, crude oil prices have dropped significantly over the past two weeks, and the food index is also falling, so progress can be made with inflation overall. Depending on its strength, I believe we will make substantial progress. On the other hand, wage growth expectations continue to rise (rightfully), making it challenging for the Fed to win this battle without increasing the unemployment rate.
While the Fed anticipates that this rate will be higher in 2023 and 2024, the labor market is extremely tight and robust, and it is uncertain which of these factors will have the greatest impact in the medium term. On the other hand, I believe that the short-term inflation rate will decline significantly due to a combination of factors, including the base effect and falling food index and crude oil prices.
CPI breakdown in May (Gurufocus)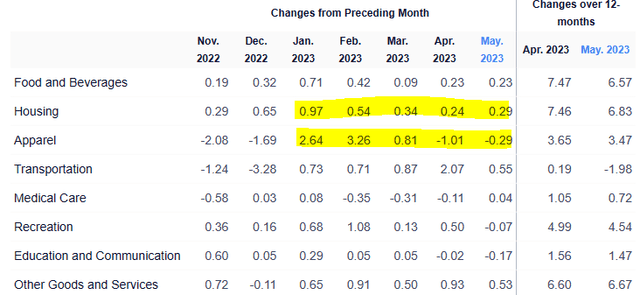
S&P 500 earnings yield vs. US10Y
Below is the evolution of the S&P 500 earnings yield versus the US10 yield. For those unaware, the earnings yield is calculated by dividing the S&P P/E by one. The current value of 4.02% corresponds to a P/E ratio of 24.8. From a historical standpoint, this possesses no appeal. However, the 10-year Treasury yield is getting closer and closer to the S&P earnings yield, and if yields continue to rise, there is a strong possibility that it will surpass it. If this were to occur, there would be no reason to hold S&P, as it would be extremely expensive relative to its earnings and you could achieve similar gains with lower volatility.
S&P 500 earnings yield vs. US10Y (Gurufocus.)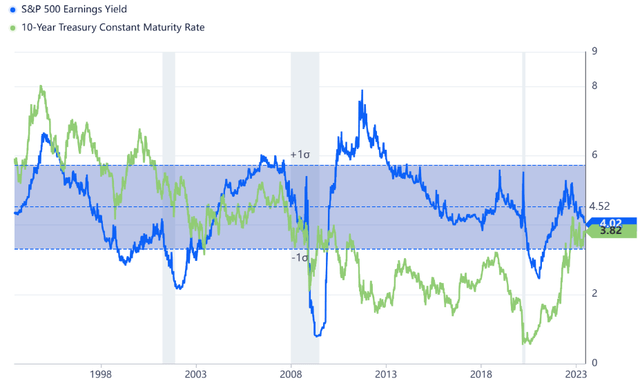
Model is pretty direct – yields should be higher
I created a scatter-plot of US10Y and Core CPI YoY% (monthly) after discovering a strong correlation, as suggested by Longview Economics. As shown in the graph, the relationship between these variables changed significantly between 2021/2022 and 2023 as a result of FRED’s highly unconventional monetary policy (affected by quantitative easing) and the financial and market stability constraints on the functioning of a fully free market. The relationship between variables was extremely strong, and the linear regression and curve were slightly exaggerated as a result of accounting for 2021-2023 datasets. Previously, when core inflation was similarly elevated, US10Y had been significantly higher.
However, despite information about the reduction of the Fed´s balance sheet, there is still activity on the bond market in the case of some reinvestments. That´s also the reason why the market just cannot fully adapt to pre-covid conditions, both from a yield curve perspective, and it is very questionable if it could be looking forward.
Historical evidence of US10Y and Core Inflation (CPI, YoY %) (Author´s calculation. Data by FRED.)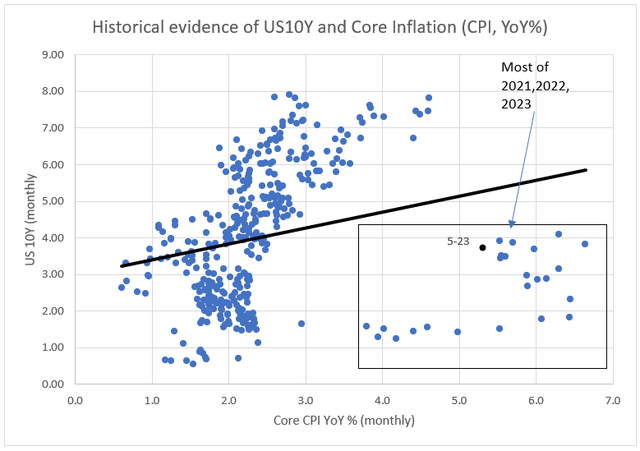
Almost certainly not in full mode, but the Fed’s balance sheet (for securities) should decline if there is no imminent tail event. Even if core inflation fell rapidly from its current level of 5.3% to 4.5%, the model-based US10Y would still be near 4.9%. However, if long-term inflation is anchored in the current manner and the Fed does not ease monetary policy, yields should be higher, in my opinion. However, from a Risk/Reward perspective, it is not worthwhile to be bearish on bonds, despite the existence of such strong historical evidence. However, this strategy is contingent on monetary policy – when there will be a solid continuation of asset reduction or a cessation of principal reinvestment – and even with lower core inflation, it could drive yields higher.
As I previously stated, however, it does not make sense to be bearish on long-term bonds due to their unattractive R/R and lack of protection from global financial stability. However, these factors are not bullish for SPY, iShares 7-10 Year Treasury Bond ETF (IEF), or iShares Core U.S. Aggregate Bond ETF (AGG), as core inflation is more persistent and it is not worthwhile to fight the Fed.
As previously calculated, valuations reflect the expensive market that is also significantly impacted by AI mania, so the current pricing with the current global monetary policy is not bullish from a medium-term perspective, in my opinion. However, it may be preferable to consider money market funds such as JPST or to conduct thorough research and stock-picking, which could generate higher returns with less volatility. Given current market conditions, it makes sense to hold long-duration bonds if you seek a combination of long-term solid yield and protection. However, as stated, there are risks that are, in my opinion, undervalued..
Insiders are not buying this rally
During this very specific cycle, there is no insider buying activity comparable to that observed during the previous years’ spikes in S&P 500 earnings yield. This merely confirms that insiders continue to view such pricing relative to valuation as unattractive. Regarding the ratio of insider purchases to sales, we observe nothing extraordinary.
Insiders are not buying this rally. (Author via gurufocus.)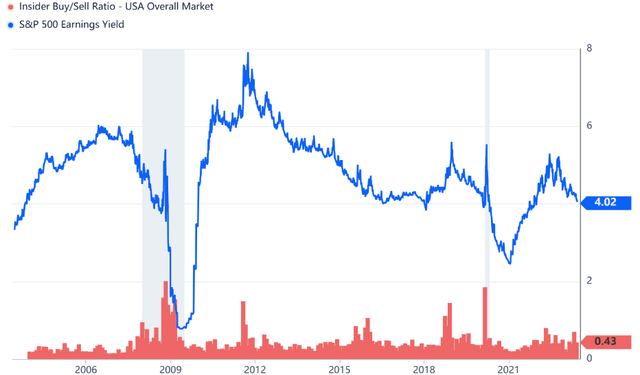
Despite this, we are persuaded that it is currently preferable to be long bonds rather than long SPY. Nevertheless, the optimal strategy should involve stock selection and money market options, while avoiding SPY, and being hold on IEF, and AGG.
Put-Call ratio indicates short-term reversal
While there are numerous bullish players in the market, the previous rally has brought us close to a short-term extreme. I evaluated a 7-day moving average on the Put-Call ratio to avoid spikes and reveal the underlying trend. Based on a 7-day moving average from 2022, the Put-Call ratio ranks second lowest. In the previous medium-term cycle, it strongly suggested that a reversal is imminent. However, this is not always the case, as the ratio can become much lower and the market can become even more aggressive; nevertheless, the historical context is fairly clear.
Put-call ratio reversal (Author´s calculation. Tradingview.)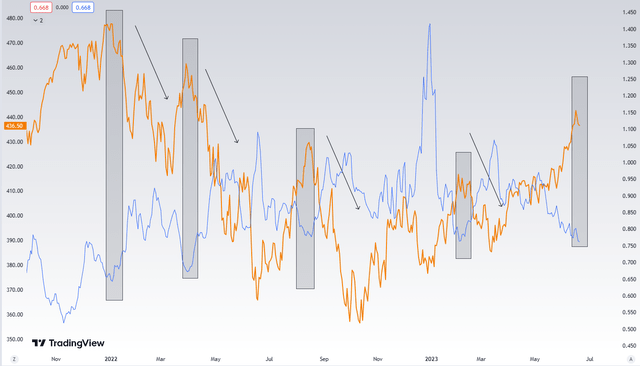
Summary and risks
Taking into account an even more hawkish Fed with a newly projected dot-plot, I believe that the most recent rally has been extremely aggressive. Fed is aware that inflation is increasing, but not as rapidly as they had anticipated. At this point, they assume that additional work must be completed. When examining inflation-leading indicators such as PPI, ISM Pride Paid, and M2, it is clear that inflation is decreasing. And while the headline CPI is decreasing, the Core CPI remains elevated. Increasing wages and a very tight labor market represent the Fed’s challenge. The market-based pricing of interest rates is convinced that the Fed will not maintain the dot-plot projection in 2023 or 2024 and will cut quite aggressively as a result of a sharp drop in inflation. However, survey, market, and Fed’s model inflation forecasts vary significantly. Increased global tightening, including by the Fed, is negative for earnings and could continue to press down margins in industries sensitive to interest rates. According to our model, which was inspired by Longview Economics, yields could be substantially higher in the current inflationary environment. However, from the historical perspective of the latest 10-15 years, yields are attractive and give a solid protection for further turmoil.
With additional steps of monetary policy normalization (balance sheet reduction), there is a greater likelihood that rates will be market-driven, thereby increasing. In my opinion, the current environment is not bullish for SPY, IEF or AGG over the medium term. However, bonds are preferable. Such put-call ratios are also red flags for me in the case of SPY. The optimal strategy entails selecting high-quality stocks and investing in money-market funds such JPST, where you are currently compensated for waiting. As a result of persisting but diminishing inflationary pressures, global tightening, and an increase in the probability of financial instability there is a possibility of various tail-events to come.
Technology sector valuation P/E (Gurufocus)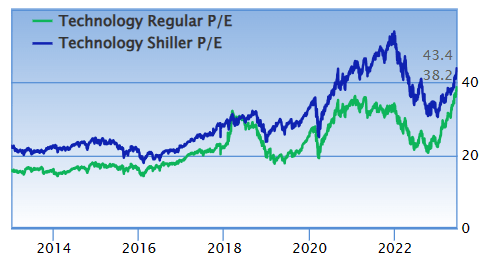
The sharp rally in SPY was merely influenced by the AI craze, or driven by the rise in the technology sector, which, thanks to AI, now has the highest P/E in years, perhaps even surpassing the dot-com bubble. However, the majority of contributions came from 8 to 10 large companies.
As stated numerous times, I may be mistaken. I was mistaken and did not believe the Fed would be able to conduct such an aggressive tightening cycle. On the contrary, there was also a tail-event which was fully backed by Fed’s lending program to protect the regional banks and maintain the financial stability. The primary risks are appropriate pricing on the market, a sharp decline in core inflation alongside a decline in inflation expectations, followed by rate cuts. The tail event would not be a bullish factor for stocks, as the outcome would remain unchanged. If you liked my work, I would greatly appreciate your comments. Please feel free to read my most recent materials on the banking industry and solid play in the market.
Read the full article here


